
Mathematics
The inter quartile range for the given ogive is :
42
32
44
54
Statistics
10 Likes
Answer
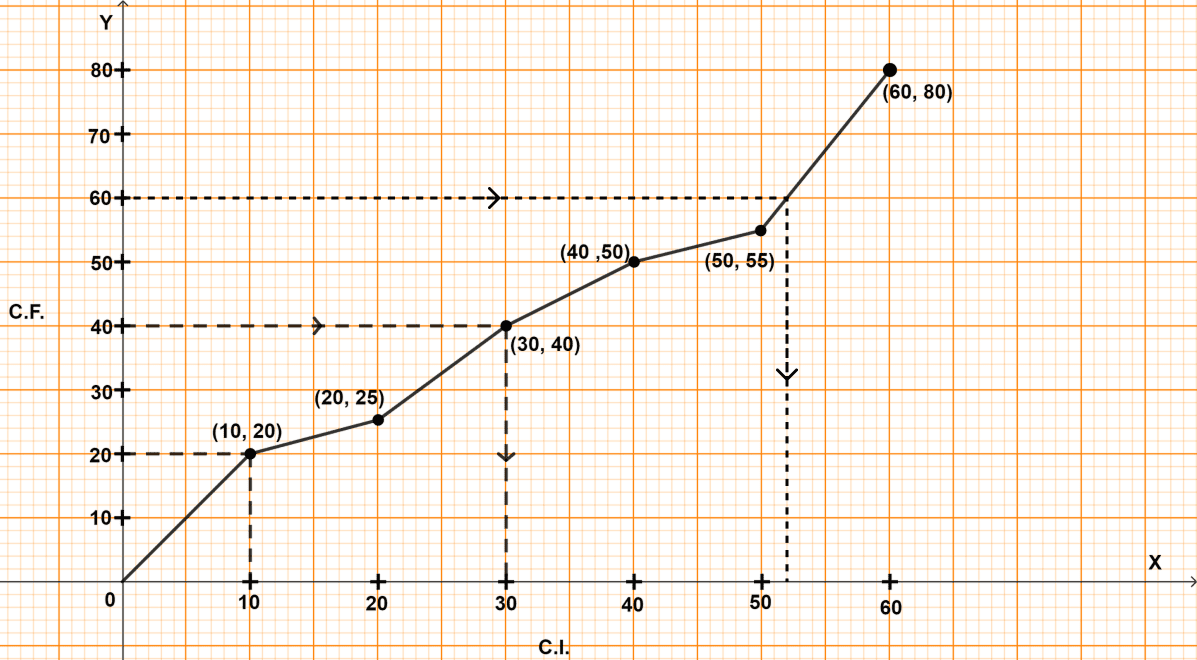
No. of terms (N) = 80
Lower quartile (Q1) = th term
= = 20 th term = 10.
Upper quartile (Q3) = th term
= = 60 th term.

From point A = 60. Draw a line parallel to x-axis touching the graph at B.
From point B, draw a line parallel to y-axis touching graph at C.
From graph, point C = 52.
∴ Upper quartile (Q3) = 52
By formula,
Inter quartile range = Upper quartile - Lower quartile
= Q3 - Q1
= 52 - 10 = 42.
Hence, Option 1 is the correct option.
Answered By
5 Likes
Related Questions
The numbers 10, 12, 14, 16, 17 and x are in ascending order. If the mean and median of these observations are same, the value of x is :
16
14
54
21
The median of first six prime numbers is :
5
7
6
7.5
The mean age of nine boys is 28 years and if one new boy joins them the mean age increases by one.
Assertion(A): The age of new boy is (29 x 10 - 28 x 9) years.
Reason(R): The age of new boy is (29 - 28) x 10 years.
A is true, R is false.
A is false, R is true.
Both A and R are true and R is correct reason for A.
Both A and R are true and R is incorrect reason for A.
Data = 37, 41, 56, 62, 70, 74, 81, 89, 95 and 90.
Assertion(A): Median = 72.
Reason(R): If number of data(n) is odd, the median = term.
A is true, R is false.
A is false, R is true.
Both A and R are true and R is correct reason for A.
Both A and R are true and R is incorrect reason for A.