
Mathematics
The marks obtained by 100 students in a Mathematics test are given below :
| Marks | No. of students |
|---|---|
| 0 - 10 | 3 |
| 10 - 20 | 7 |
| 20 - 30 | 12 |
| 30 - 40 | 17 |
| 40 - 50 | 23 |
| 50 - 60 | 14 |
| 60 - 70 | 9 |
| 70 - 80 | 6 |
| 80 - 90 | 5 |
| 90 - 100 | 4 |
Draw an ogive on a graph sheet and from it determine the :
(i) median
(ii) lower quartile
(iii) number of students who obtained more than 85% marks in the test
(iv) number of students who did not pass in the test if the pass percentage was 35.
Measures of Central Tendency
72 Likes
Answer
- The cumulative frequency table for the given continuous distribution is :
| Marks | No. of students | Cumulative frequency |
|---|---|---|
| 0 - 10 | 3 | 3 |
| 10 - 20 | 7 | 10 |
| 20 - 30 | 12 | 22 |
| 30 - 40 | 17 | 39 |
| 40 - 50 | 23 | 62 |
| 50 - 60 | 14 | 76 |
| 60 - 70 | 9 | 85 |
| 70 - 80 | 6 | 91 |
| 80 - 90 | 5 | 96 |
| 90 - 100 | 4 | 100 |
Take 1 cm along x-axis = 10 (marks)
Take 1 cm along y-axis = 10 (students)
Plot the points (10, 3), (20, 10), (30, 22), (40, 39), (50, 62), (60, 76), (70, 85), (80, 91), (90, 96) and (100, 100) representing upper class limits and the respective cumulative frequencies. Also plot the point representing lower limit of the first class i.e. 0 - 10.
Join these points by a freehand drawing.
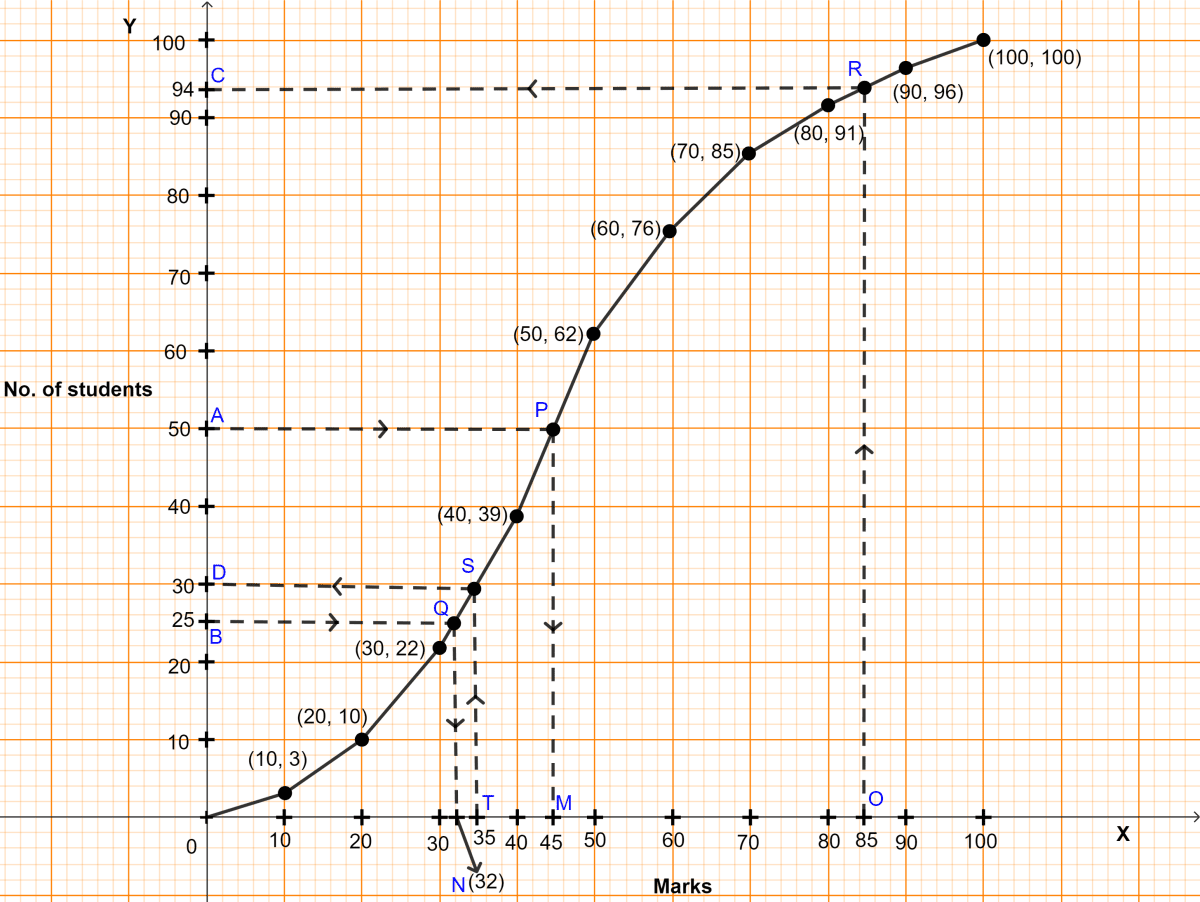
The required ogive is shown in figure above.
(i) Here, n (no. of students) = 100.
To find the median :
Let A be the point on y-axis representing frequency = = 50.
Through A draw a horizontal line to meet the ogive at P. Through P, draw a vertical line to meet the x-axis at M. The abscissa of the point M represents 45
Hence, the median marks = 45.
(ii) To find lower quartile :
Let B be the point on y-axis representing frequency = = 25.
Through B, draw a horizontal line to meet the ogive at Q. Through Q, draw a vertical line to meet the x-axis at N. The abscissa of the point N represents 32.
Hence, lower quartile = 32.
(iii) Total marks = 100.
85% marks = 85 numbers.
Let O be the point on x-axis representing marks = 85.
Through O draw a vertical line to meet the ogive at R. Through R, draw a horizontal line to meet the y-axis at C. The ordinate of the point C represents 94.
Hence, 94 students score less than 85 so students scoring more than 85 = 100 - 94 = 6.
Hence, 6 students score more than 85% in the test.
(iv) 35% of 100 = 35.
Let T be the point on x-axis representing marks = 35.
Through T, draw a vertical line to meet the ogive at S. Through S, draw a horizontal line to meet the y-axis at D. The ordinate of the point D represents 30.
No. of students who scored less than 35 marks = 30.
Hence, 30 students were failed in the examination.
Answered By
12 Likes
Related Questions
Use graph paper for this question.
A survey regarding height (in cm) of 60 boys belonging to class 10 of a school was conducted. The following data was recorded :
Height (in cm) No. of boys 135 - 140 4 140 - 145 8 145 - 150 20 150 - 155 14 155 - 160 7 160 - 165 6 165 - 170 1 Taking 2 cm = height of 10 cm on one axis and 2 cm = 10 boys along the other axis, draw an ogive of the above distribution. Use the graph to estimate the following :
(i) median
(ii) lower quartile
(iii) if above 158 is considered as the tall boy of the class, find the number of boys in the class who are tall.
40 students enter for a game of a shot put competition. The distance thrown in metre is recorded below:
Distance in m Number of students 12 - 13 3 13 - 14 9 14 - 15 12 15 - 16 9 16 - 17 4 17 - 18 2 18 - 19 1 Use a graph paper to draw an ogive for the above distribution.
Uses scale of 2 cm = 1 m on one axis and 2 cm = 5 students on other axis.
Hence, using your graph, find:
(i) the median
(ii) upper quartile
(iii) number of students who cover a distance which is above m.
The marks obtained by 120 students in a Mathematics test are given below:
Marks No. of students 0 - 10 5 10 - 20 9 20 - 30 16 30 - 40 22 40 - 50 26 50 - 60 18 60 - 70 11 70 - 80 6 80 - 90 4 90 - 100 3 Draw an ogive for the given distribution on a graph sheet. Use a suitable scale for ogive to estimate the following :
(i) the median
(ii) the number of students who obtained more than 75% marks in the test.
(iii) the number of students who did not pass in the test if the pass percentage was 40.
The following distribution represents the height of 160 students of a school.
Height (in cm) No. of students 140 - 145 12 145 - 150 20 150 - 155 30 155 - 160 38 160 - 165 24 165 - 170 16 170 - 175 12 175 - 180 8 Draw an ogive for the given distribution taking 2 cm = 5 cm of height on one axis and 2 cm = 20 students on the other axis. Using the graph, determine :
(i) The median height.
(ii) The inter quartile range.
(iii) The number of students whose height is above 172 cm.