Robotics & Artificial Intelligence
What type of graph is shown in the image?
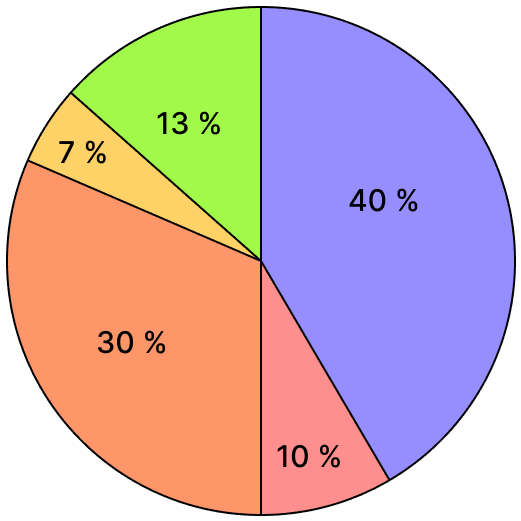
- Line graph
- Bar graph
- Pie chart
- Scatter plot
Related Questions
Assertion (A): The Turing Test helps in evaluating the intelligence of a machine.
Reason (R): The Turing Test checks if a machine can exhibit human-like behavior.
- Both A and R are true, and R is the correct explanation of A
- Both A and R are true, but R is not the correct explanation of A
- A is true, but R is false
- A is false, but R is true
What are the 4 Ws used for understanding a problem in AI project scoping?
- Who, What, When, Where
- Why, When, Where, What
- Who, What, Where, Why
- Who, Where, When, Why
What does the following code output?
string = "Hello World" print(string[1:5])- "Hell"
- "ello"
- "World"
- "Hello"
The full form of IDLE is:
- Integrated Development and Language Environment.
- Integrated Development and Learning Environment.
- Inline Development and Learning Environment.
- Inside Development and Language Environment.