
Mathematics
Using a graph paper, draw a histogram for the given distribution showing the number of runs scored by 50 batsmen. From the histogram, estimate the mode of the data:
| Runs scored | No. of batsmen |
|---|---|
| 3000 - 4000 | 4 |
| 4000 - 5000 | 18 |
| 5000 - 6000 | 9 |
| 6000 - 7000 | 6 |
| 7000 - 8000 | 7 |
| 8000 - 9000 | 2 |
| 9000 - 10000 | 4 |
Measures of Central Tendency
1 Like
Answer
Steps :
Take 1 cm along x-axis = 1000 runs and 1 cm along y-axis = 4(batsman).
Construct rectangles corresponding to the given data.
In highest rectangle, draw two st. lines AC and BD from corners of the rectangles on either side of the highest rectangle to the opposite corners of the highest rectangle. Let P be the point of intersection of AC and BD.
Through P, draw a vertical line to meet the x-axis at M. The abscissa of the point M represents 4600.
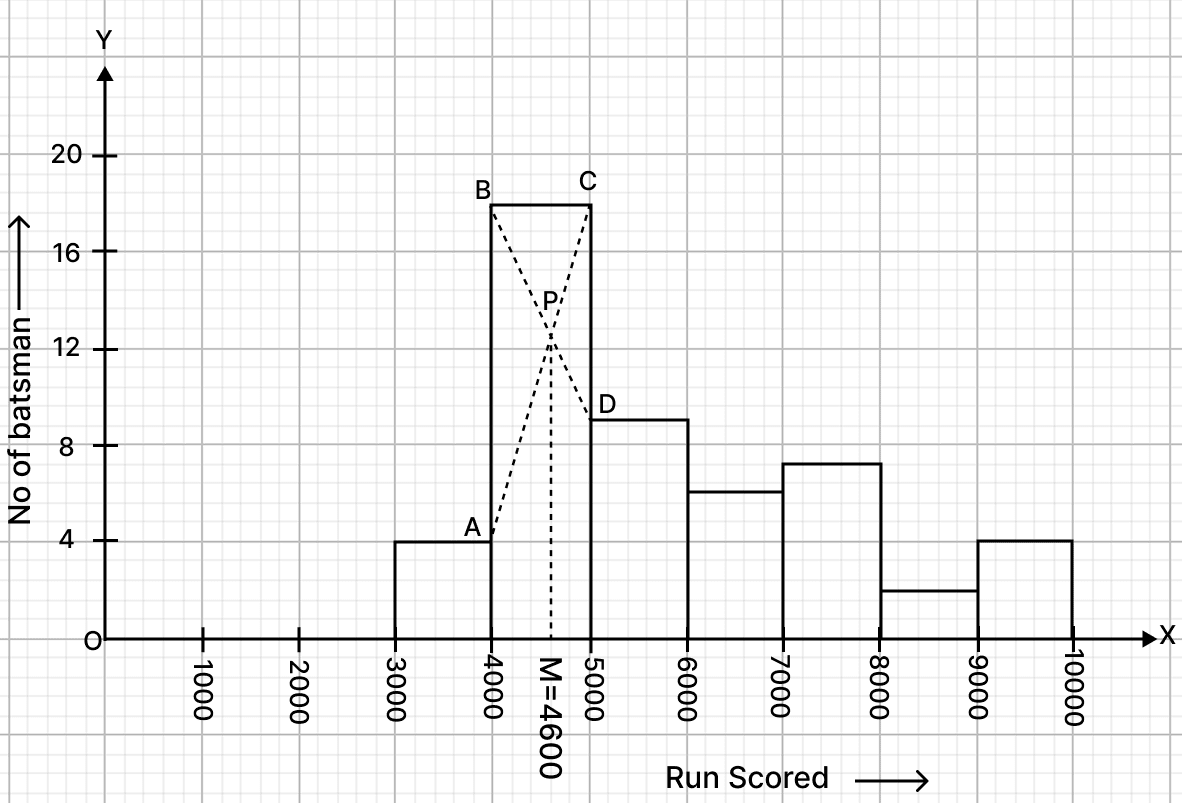
Hence, the required mode = 4600 runs.
Answered By
1 Like
Related Questions
IQ of 50 students was recorded as follows:
IQ score No. of students 80 - 90 6 90 - 100 9 100 - 110 16 110 - 120 13 120 - 130 4 130 - 140 2 Draw a histogram for the above data and estimate the mode.
For the following distribution, draw a histogram :
Weight (in kg) Frequency 44 - 47 23 48 - 51 25 52 - 55 37 56 - 59 18 60 - 63 7 64 - 67 2 From the histogram, estimate the mode.
Draw a histogram for the given data, using a graph paper:
Weekly Wages (in ₹) No. of people 3000 - 4000 4 4000 - 5000 9 5000 - 6000 18 6000 - 7000 6 7000 - 8000 7 8000 - 9000 2 9000 - 10000 4 Estimate the mode from the graph.
Marks obtained by 100 students in an examination are given below:
Marks No. of students 0 - 10 5 10 - 20 15 20 - 30 20 30 - 40 28 40 - 50 20 50 - 60 12 Draw a histogram for the given data using a graph paper and find the mode. Take 2 cm = 10 marks along one axis and 2 cm = 10 students along the other axis.