
Mathematics
Using a graph paper, draw an ogive for the distribution which shows the marks obtained on the General knowledge paper by 100 students.
| Marks | No. of students |
|---|---|
| 0 - 10 | 5 |
| 10 - 20 | 10 |
| 20 - 30 | 20 |
| 30 - 40 | 25 |
| 40 - 50 | 15 |
| 50 - 60 | 12 |
| 60 - 70 | 9 |
| 70 - 80 | 4 |
Use the ogive to estimate:
(i) the median
(ii) the number of students whose score is above 65.
Measures of Central Tendency
2 Likes
Answer
Cumulative frequency distribution table :
| Marks | Number of students | Cumulative frequency |
|---|---|---|
| 0 - 10 | 5 | 5 |
| 10 - 20 | 10 | 15 (10 + 5) |
| 20 - 30 | 20 | 35 (15 + 20) |
| 30 - 40 | 25 | 60 (35 + 25) |
| 40 - 50 | 15 | 75 (60 + 15) |
| 50 - 60 | 12 | 87 (75 + 12) |
| 60 - 70 | 9 | 96 (87 + 9) |
| 70 - 80 | 4 | 100 (96 + 4) |
Here, n = 100, which is even.
(i) Steps of construction:
Take 1 cm along x-axis = 10 marks
Take 2 cm along y-axis = 20 students
Plot the point (0, 0) as ogive starts from x- axis representing lower limit of first class.
Plot the points (10, 5), (20, 15), (30, 35), (40, 60), (50, 75), (60, 87), (70, 96), (80, 100).
Joint the points by a free hand curve.
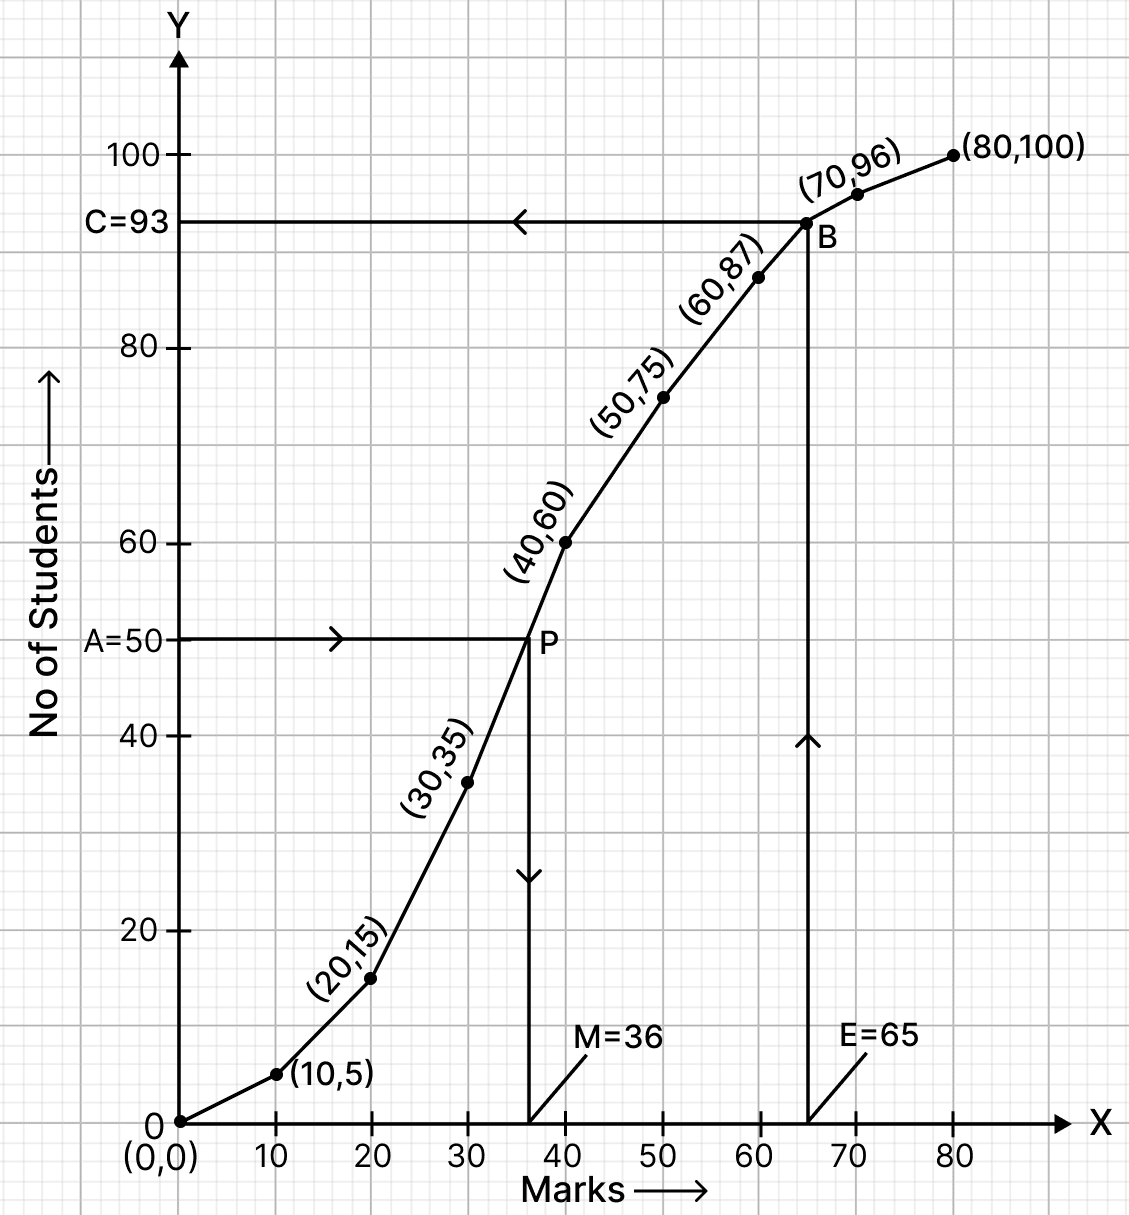
To find the median :
Let A be the point on y-axis representing frequency = = 50.
Through A draw a horizontal line to meet the ogive at P. Through P, draw a vertical line to meet the x-axis at M. The abscissa of the points M represents 36.
Hence, the median is 36.
(ii) Total marks = 100.
Let E be the point on x-axis representing marks = 65.
Through E draw a vertical line to meet the ogive at B. Through B, draw a horizontal line to meet the y-axis at C. The ordinate of the point C represents 93.
Hence, 93 students score less than or equal to 65, so, students scoring more than 65 = 100 - 93 = 7.
Hence, the number of students who scored more than 65 marks is 7.
Answered By
2 Likes
Related Questions
The daily wages of 80 workers in a project are given below:
Wages (in ₹) Number of workers 400 - 450 2 450 - 500 6 500 - 550 12 550 - 600 18 600 - 650 24 650 - 700 13 700 - 750 5 Use a graph paper to draw an ogive for the above distribution. (Use a scale of 2 cm = ₹ 50 on x-axis and 2 cm = 10 workers on y-axis). Use your ogive to estimate:
(i) the median wage of the workers.
(ii) the lower quartile wage of the workers.
(iii) the number of workers who earn more than ₹ 625 daily.
Using a graph paper, draw an ogive for the following distribution which shows a record of the weight in kilograms of 200 students.
Weight (in kg) No. of students 40 - 45 5 45 - 50 17 50 - 55 22 55 - 60 45 60 - 65 51 65 - 70 31 70 - 75 20 75 - 80 9 Use your ogive to estimate the following :
(i) the percentage of students weighing 55 kg or more
(ii) the weight above which the heaviest 30% of the students fall
(iii) the number of students who are (a) under weight and (b) Over-weight, if 55.70 kg is considered as standard weight.
The table shows the distribution of the scores obtained by 160 shooters in a shooting competition. Use a graph sheet and draw an ogive for the distribution (take 2 cm = 10 scores on the x-axis and 2 cm = 20 shooters on the y-axis.)
Scores Number of shooters 0 - 10 9 10 - 20 13 20 - 30 20 30 - 40 26 40 - 50 30 50 - 60 22 60 - 70 15 70 - 80 10 80 - 90 8 90 - 100 7 Use your graph to estimate the following:
(i) the median
(ii) the inter-quartile range
(iii) the number of shooters who obtained a score of more than 85%
A survey regarding height (in cm) of 60 boys belonging to class 10 of a school was conducted. The following data was recorded:
Height (in cm) Number of boys 135 - 140 4 140 - 145 8 145 - 150 20 150 - 155 14 155 - 160 7 160 - 165 6 165 - 170 1 Taking 2 cm = height of 10 cm along one axis and 2 cm = 10 boys along the other axis, draw an ogive of the above distribution. Use the graph to estimate the following :
(i) the median
(ii) the lower quartile
(iii) if above 158 cm is considered as the tall boys of the class, find the number of boys in the class who are tall.