
Robotics & Artificial Intelligence
Write a Python program to plot a bar chart using the Matplotlib library. Your program should:
- Import the necessary libraries.
- Create a list of categories and their corresponding values.
- Plot a bar chart with appropriate labels and a title.
Python Modules
1 Like
Answer
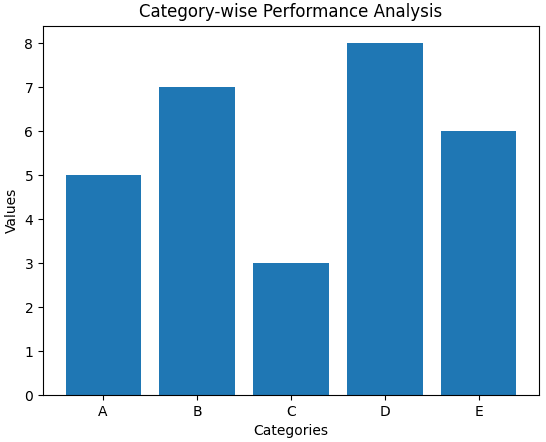
import matplotlib.pyplot as plt
categories = ['A', 'B', 'C', 'D', 'E']
values = [5, 7, 3, 8, 6]
plt.bar(categories, values)
plt.xlabel('Categories')
plt.ylabel('Values')
plt.title('Category-wise Performance Analysis')
plt.show()
Output
Answered By
1 Like
Related Questions
How do assistant robots in healthcare improve patient care? Provide two specific examples.
What are the main differences between subjective decision making by humans and objective decision making by machines?
Explain the key differences between traditional industrial robots and cobots. Why are cobots considered more suitable for collaborative tasks?
Describe the steps involved in a machine learning project using the example of fruit sorting.