
Robotics & Artificial Intelligence
Write a Python program to plot a bar chart using the Matplotlib library. Your program should do the following:
- Import the necessary libraries.
- Create a list of categories and their corresponding values.
- Plot a bar chart with appropriate labels and a title.
Python Modules
1 Like
Answer
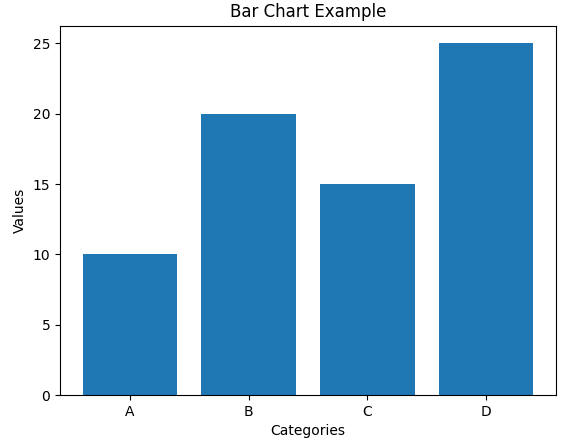
import matplotlib.pyplot as plt
categories = ['A', 'B', 'C', 'D']
values = [10, 20, 15, 25]
plt.bar(categories, values)
plt.xlabel('Categories')
plt.ylabel('Values')
plt.title('Bar Chart Example')
plt.show()
Output
Answered By
2 Likes