
The mean of numbers in A.P. 2, 4, 6, 8, ......, 40 is :
(2 + 40)
840
Answer
Given,
A.P. = 2, 4, 6, 8, ……, 40
First term (a) = 2
Common difference (d) = 4 - 2 = 2
Last term (l) = 40
Let no. of terms in A.P. be n.
⇒ 40 = a + (n - 1)d
⇒ 40 = 2 + 2(n - 1)
⇒ 40 = 2 + 2n - 2
⇒ 2n = 40
⇒ n = = 20.
By formula,
Sum of first n terms of an A.P. = .
Mean = = 21.
Solving,
= 21.
Hence, option 1 is the correct option.
The median of 10, 12, 9, 8, 12, 13, 8, 15 and 12 is :
12
13
Answer
Numbers in ascending order :
8, 8, 9, 10, 12, 12, 12, 13, 15.
Number of terms (n) = 9
∴ Median = = 5th term = 12.
Hence, Option 1 is the correct option.
The numbers 10, 12, 14, 16, 17 and x are in ascending order. If the mean and median of these observations are same, the value of x is :
16
14
54
21
Answer
Numbers in ascending order :
10, 12, 14, 16, 17 and x.
Mean =
Substituting values we get :
No. of terms (n) = 6, which is even.
Median =
Substituting values we get :
Given,
Mean = Median
Hence, Option 4 is the correct option.
The median of first six prime numbers is :
5
7
6
7.5
Answer
Prime numbers : 2, 3, 5, 7, 11, 13.
No. of terms (n) = 6, which is even.
Median =
Substituting values we get :
Hence, Option 3 is the correct option.
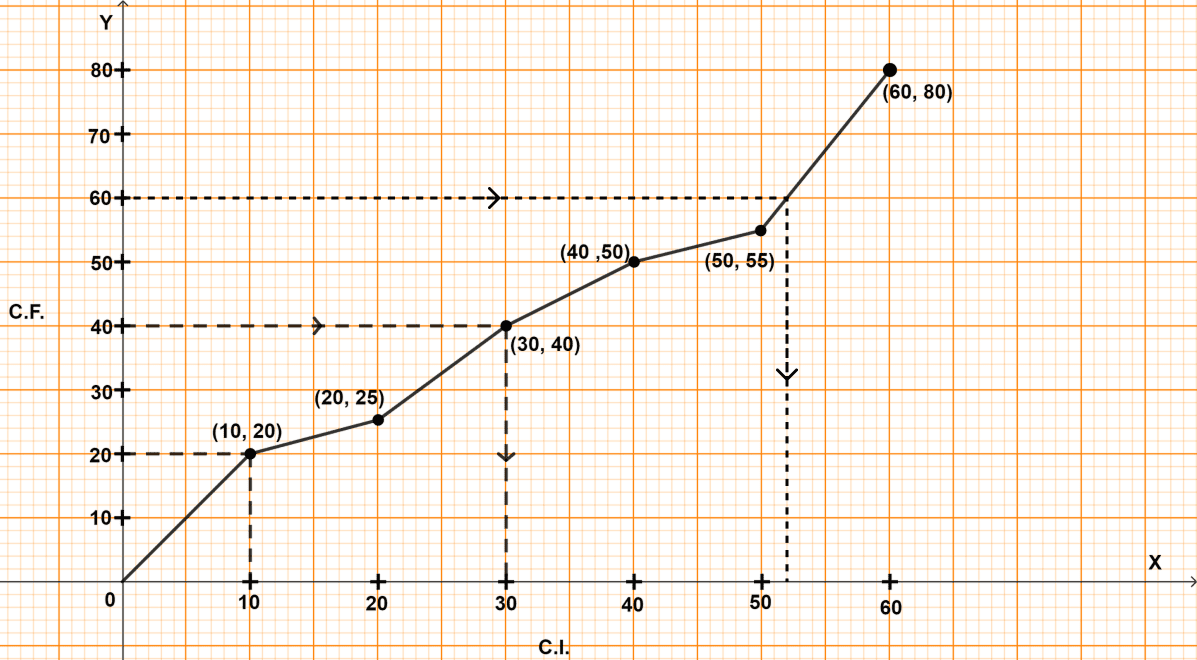
The inter quartile range for the given ogive is :
42
32
44
54
Answer
No. of terms (N) = 80
Lower quartile (Q1) = th term
= = 20 th term = 10.
Upper quartile (Q3) = th term
= = 60 th term.

From point A = 60. Draw a line parallel to x-axis touching the graph at B.
From point B, draw a line parallel to y-axis touching graph at C.
From graph, point C = 52.
∴ Upper quartile (Q3) = 52
By formula,
Inter quartile range = Upper quartile - Lower quartile
= Q3 - Q1
= 52 - 10 = 42.
Hence, Option 1 is the correct option.
The mean age of nine boys is 28 years and if one new boy joins them the mean age increases by one.
Assertion(A): The age of new boy is (29 x 10 - 28 x 9) years.
Reason(R): The age of new boy is (29 - 28) x 10 years.
A is true, R is false.
A is false, R is true.
Both A and R are true and R is correct reason for A.
Both A and R are true and R is incorrect reason for A.
Answer
Given, the mean age of 9 boys is 28 years.
when one new boy joins, the mean age increases by 1 year, making the new mean 29 years
By formula,
Mean =
The mean age of 9 boys is 28 years.
After the new boy joins, the mean age becomes 29 years for 10 boys.
The age of the new boy is the difference between the total age of 10 boys and the total age of 9 boys = 29 x 10 - 28 x 9
∴ A is true, R is false.
Hence, option 1 is the correct option.
Data = 37, 41, 56, 62, 70, 74, 81, 89, 95 and 90.
Assertion(A): Median = 72.
Reason(R): If number of data(n) is odd, the median = term.
A is true, R is false.
A is false, R is true.
Both A and R are true and R is correct reason for A.
Both A and R are true and R is incorrect reason for A.
Answer
Given, data = 37, 41, 56, 62, 70, 74, 81, 89, 95 and 90.
Arrange the data in ascending order: 37, 41, 56, 62, 70, 74, 81, 89, 90, 95
Number of data = 10
If the number of data points (n) is odd, the median is the term
If the number of data points (n) is even, the median is the
Here, n = 10
∴ Both A and R are true and R is incorrect reason for A.
Hence, option 4 is the correct option.
| C.I. | 0 - 10 | 10 - 20 | 20 - 30 |
|---|---|---|---|
| Frequency | 15 | 25 | b |
| Cumulative frequency | 15 | a | 50 |
Assertion(A): a = 15 + 25 = 40
b = 50 - a
Reason(R): a + 15 = 25
and b = 50 - 10
A is true, R is false.
A is false, R is true.
Both A and R are true and R is correct reason for A.
Both A and R are true and R is incorrect reason for A.
Answer
Cumulative frequency represents the running total of frequencies up to a certain class interval. For instance, the cumulative frequency for the class interval 10–20 includes all frequencies from the previous intervals as well. Therefore, the cumulative frequency for the 10–20 interval is the sum of the frequencies for the 0–10 and 10–20 intervals.
The cumulative frequency for the 10–20 interval is the sum of the frequencies for the 0–10 and 10–20 intervals:
a = 15 + 25 = 40
The cumulative frequency for the 20–30 interval is 50, which includes all previous frequencies. Therefore, the frequency for the 20–30 interval is:
b = 50 - a = 50 - 40 = 10.
∴ A is true, R is false.
Hence, option 1 is the correct option.
Data : 9, 11, 15, 19, 17, 13 and 7
Statement (1): For the given data, lower quantile is 11.
Statement (2): For data with n terms, the lower quantile is term, if n is odd.
Both the statements are true.
Both the statements are false.
Statement 1 is true, and statement 2 is false.
Statement 1 is false, and statement 2 is true.
Answer
Given data : 9, 11, 15, 19, 17, 13 and 7
Arrange the data in ascending order : 7, 9, 11, 13, 15, 17, 19.
For data with n terms, the lower quantile is term, if n is odd
Here, n = 7
∴ Statement 1 is false, and statement 2 is true.
Hence, option 4 is the correct option.
The mean of given data is 26.
| C.I. | 0 - 20 | 20 - 40 | 40 - 60 |
|---|---|---|---|
| f | 20 | x | 10 |
Statement (1): x = 26.
Statement (2): 26 = .
Both the statement are true.
Both the statement are false.
Statement 1 is true, and statement 2 is false.
Statement 1 is false, and statement 2 is true.
Answer
Given:
| C.I. | f | x(Midpoint) = (Lower limit + upper limit)/2 |
|---|---|---|
| 0-20 | 20 | 10 |
| 20-40 | x | 30 |
| 40-60 | 10 | 50 |
By formula; Mean =
Substituting the values, we get
∴ Statement 1 is false, and statement 2 is true.
Hence, option 4 is the correct option.
For a given set of data mean = 14 and median = 15.
Statement (1): Mode = 17.
Statement (2): Mode = 3 Median - 2 Mean s
Both the statements are true.
Both the statements are false.
Statement 1 is true, and statement 2 is false.
Statement 1 is false, and statement 2 is true.
Answer
Given, mean = 14 and median = 15
By formula,
Mode = 3 Median - 2 Mean
So, statement 2 is true.
Substituting the values, we get :
⇒ Mode = 3 x 15 - 2 x 14
⇒ Mode = 45 - 28
⇒ Mode = 17.
So, statement 1 is true.
∴ Both the statement are true.
Hence, option 1 is the correct option.
The mean of 1, 7, 5, 3, 4 and 4 is m. The numbers 3, 2, 4, 2, 3, 3 and p have mean m - 1 and median q. Find p and q.
Answer
Given,
Mean of 1, 7, 5, 3, 4 and 4 is m.
Sum of observations = 1 + 7 + 5 + 3 + 4 + 4 = 24.
Mean (m) = = 4.
Given,
Numbers 3, 2, 4, 2, 3, 3 and p have mean m - 1 or mean = 3.
Sum of observations = 3 + 2 + 4 + 2 + 3 + 3 + p = 17 + p.
Mean (m) =
⇒ 3 =
⇒ 21 = 17 + p
⇒ p = 4.
Observations in ascending order are = 2, 2, 3, 3, 3, 4, 4.
Here, n = 7, which is odd.
By formula,
Median = th term
= = 4th term = 3.
∴ q = 3.
Hence, p = 4 and q = 3.
In a malaria epidemic, the number of cases diagnosed were as follows :
| Date (July) | Number |
|---|---|
| 1 | 5 |
| 2 | 12 |
| 3 | 20 |
| 4 | 27 |
| 5 | 46 |
| 6 | 30 |
| 7 | 31 |
| 8 | 18 |
| 9 | 11 |
| 10 | 5 |
| 11 | 0 |
| 12 | 1 |
On what days do the mode, the upper and the lower quartiles occur ?
Answer
Cumulative frequency distribution table :
| Date (July) | Number (frequency) | Cumulative frequency |
|---|---|---|
| 1 | 5 | 5 |
| 2 | 12 | 17 (5 + 12) |
| 3 | 20 | 37 (17 + 20) |
| 4 | 27 | 64 (37 + 27) |
| 5 | 46 | 110 (64 + 46) |
| 6 | 30 | 140 (110 + 30) |
| 7 | 31 | 171 (140 + 31) |
| 8 | 18 | 189 (171 + 18) |
| 9 | 11 | 200 (189 + 11) |
| 10 | 5 | 205 (200 + 5) |
| 11 | 0 | 205 (205 + 0) |
| 12 | 1 | 206 (205 + 1) |
Here, n = 206, which is even
Lower quartile = th term
= = 51.5 th term
From table,
It is observed the date of 38th term to 64th term is 4th july.
Upper quartile = th term
= = 154.5 th term
From table,
It is observed the date of 141st term to 171st term is 7th july.
From table,
5th july has the highest no. of cases diagnosed.
Hence, mode = 5th july, upper quartile = 7th july and lower quartile = 4th july.
The marks obtained by 120 students in a Mathematics test are given below :
| Marks | No. of students |
|---|---|
| 0 - 10 | 5 |
| 10 - 20 | 9 |
| 20 - 30 | 16 |
| 30 - 40 | 22 |
| 40 - 50 | 26 |
| 50 - 60 | 18 |
| 60 - 70 | 11 |
| 70 - 80 | 6 |
| 80 - 90 | 4 |
| 90 - 100 | 3 |
Draw an ogive for the given distribution on a graph sheet. Use a suitable scale for your ogive. Use your ogive to estimate :
(i) the median
(ii) the number of students who obtained more than 75% marks in a test ?
(iii) the number of students who did not pass in the test if the pass percentage was 40?
(iv) the lower quartile.
Answer
Cumulative frequency distribution table :
| Marks | No. of students | Cumulative frequency |
|---|---|---|
| 0 - 10 | 5 | 5 |
| 10 - 20 | 9 | 14 (5 + 9) |
| 20 - 30 | 16 | 30 (14 + 16) |
| 30 - 40 | 22 | 52 (30 + 22) |
| 40 - 50 | 26 | 78 (52 + 26) |
| 50 - 60 | 18 | 96 (78 + 18) |
| 60 - 70 | 11 | 107 (96 + 11) |
| 70 - 80 | 6 | 113 (107 + 6) |
| 80 - 90 | 4 | 117 (113 + 4) |
| 90 - 100 | 3 | 120 (117 + 3) |
(i) Steps of construction of ogive :
Take 1 cm = 10 marks on x-axis.
Take 1 cm = 20 students on y-axis.
Plot the point (0, 0) as ogive starts from x-axis representing lower limit of first class.
Plot the points (10, 5), (20, 14), (30, 30), (40, 52), (50, 78), (60, 96), (70, 107), (80, 113), (90, 117) and (100, 120).
Join the points by a free hand curve.
Draw a line parallel to x-axis from point A (no. of students) = 60, touching the graph at point B. From point B draw a line parallel to y-axis touching x-axis at point C.
From graph, C = 43
Hence, median = 43.
(ii) Total marks = 100.
75% of 100 marks = = 75.
Draw a line parallel to y-axis from point D (marks) = 75, touching the graph at point E. From point E draw a line parallel to x-axis touching y-axis at point F.
From graph, F = 110.
It means that 110 students score either less or equal to 75% marks.
No. of students left = 120 - 110 = 10.
Hence, no. of students scoring more than 75% marks = 10.
(iii) Total marks = 100.
40% of 100 marks = = 40.
Draw a line parallel to y-axis from point G (marks) = 40, touching the graph at point H. From point H draw a line parallel to x-axis touching y-axis at point I.
From graph, I = 52.
Hence, no. of failed students = 52.
(iv) Here, n = 120, which is even.
By formula,
Lower quartile = = 30th term.
Draw a line parallel to x-axis from point J (no. of students) = 30, touching the graph at point K. From point K draw a line parallel to y-axis touching x-axis at point L.
From graph, L = 30
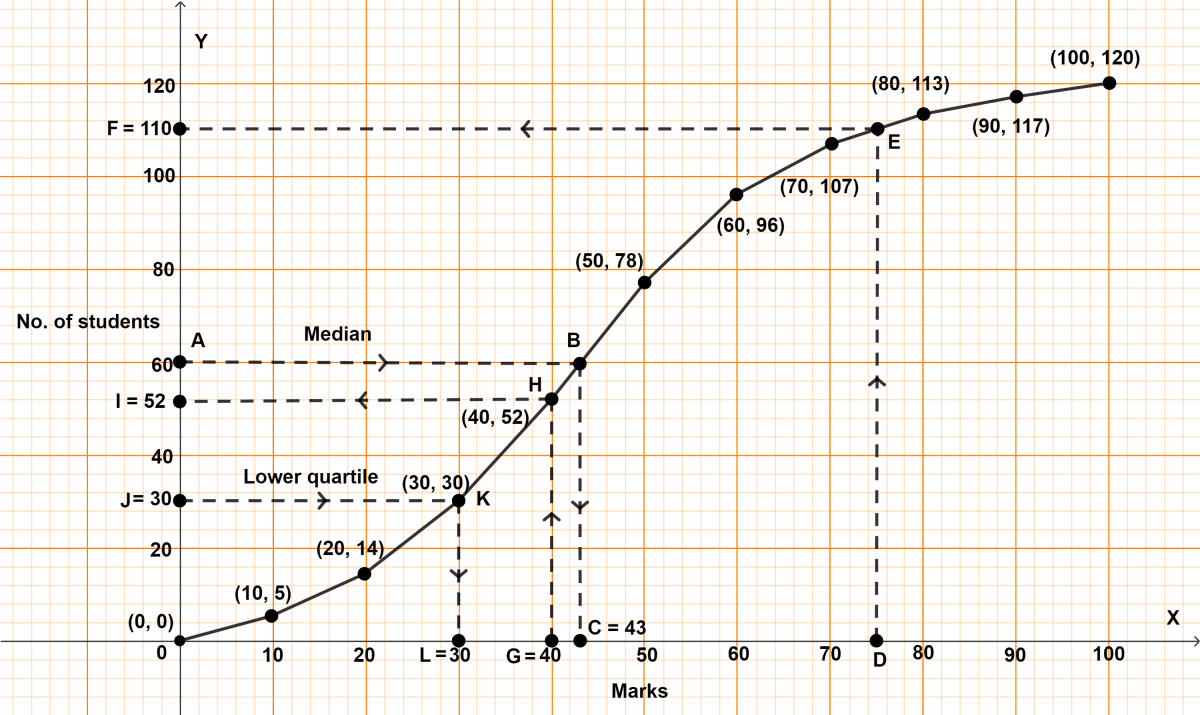
Hence, lower quartile = 30.
Using a graph paper, draw an ogive for the following distribution which shows a record of the weight in kilograms of 200 students.
| Weight | Frequency |
|---|---|
| 40 - 45 | 5 |
| 45 - 50 | 17 |
| 50 - 55 | 22 |
| 55 - 60 | 45 |
| 60 - 65 | 51 |
| 65 - 70 | 31 |
| 70 - 75 | 20 |
| 75 - 80 | 9 |
Use your ogive to estimate the following :
(i) The percentage of students weighing 55 kg or more.
(ii) The weight above which the heaviest 30% of the students fall,
(iii) The number of students who are (a) under-weight and (b) over weight, if 55.70 kg is considered as standard weight ?
Answer
(i) Cumulative frequency distribution table :
| Weight | Frequency | Cumulative frequency |
|---|---|---|
| 40 - 45 | 5 | 5 |
| 45 - 50 | 17 | 22 (5 + 17) |
| 50 - 55 | 22 | 44 (22 + 22) |
| 55 - 60 | 45 | 89 (44 + 45) |
| 60 - 65 | 51 | 140 (89 + 51) |
| 65 - 70 | 31 | 171 (140 + 31) |
| 70 - 75 | 20 | 191 (171 + 20) |
| 75 - 80 | 9 | 200 (191 + 9) |
Steps of construction :
Since, the scale on x-axis starts at 40, a break (kink) is shown near the origin on x-axis to indicate that the graph is drawn to scale beginning at 40.
Take 1 cm along x-axis = 5 kg.
Take 1 cm along y-axis = 20 units.
Plot the point (40, 0) as ogive starts from x-axis representing lower limit of first class.
Plot the points (45, 5), (50, 22), (55, 44), (60, 89), (65, 140), (70, 171), (75, 191) and (80, 200).
Join the points by a free hand curve.
Draw a line parallel to y-axis from point J (weight) = 55, touching the graph at point Q. From point Q draw a line parallel to x-axis touching y-axis at point K.
From graph, K = 44.
Hence, 44 students weight 55 kg or less.
Students weighing more than 55 kg = 200 - 44 = 156.
Percentage of students weighing more than 55 kg = = 78%.
Hence, percentage of students weighing more than 55 kg = 78%.
(ii) 30% of students = = 60.
Total students = 200
No. of Students not in heaviest 30% = 200 - 60 = 140.
Draw a line parallel to x-axis from point O (no. of students) = 140, touching the graph at point R. From point R draw a line parallel to y-axis touching x-axis at point P.
From graph, P = 65
Hence, above 65 kg the heaviest 30% of the students fall.
(iii) Draw a line parallel to y-axis from point L (weight) = 55.70 kg, touching the graph at point M. From point M draw a line parallel to x-axis touching y-axis at point N.
(a) From graph,
N = 46.
∴ 46 students have weight less than 55.70 kg
Hence, 46 students are underweight.
(b) Since, 46 students have weight less than 55.70 kg
∴ 154 (200 - 46) students have weight more than 55.70 kg
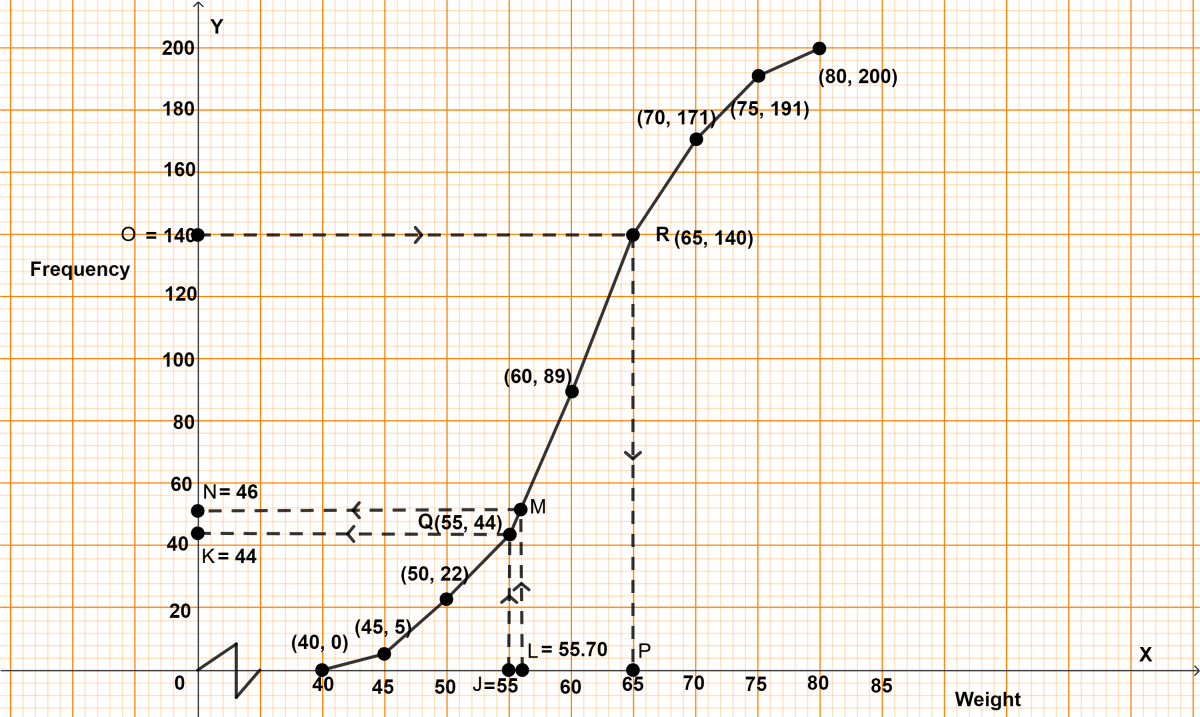
Hence, 154 students are overweight.
The distribution given below, shows the marks obtained by 25 students in an aptitude test. Find the mean, median and mode of the distribution.
| Marks obtained | No. of students |
|---|---|
| 5 | 3 |
| 6 | 9 |
| 7 | 6 |
| 8 | 4 |
| 9 | 2 |
| 10 | 1 |
Answer
Cumulative frequency distribution table :
| Marks obtained (x) | No. of students (f) | Cumulative frequency | fx |
|---|---|---|---|
| 5 | 3 | 3 | 15 |
| 6 | 9 | 12 | 54 |
| 7 | 6 | 18 | 42 |
| 8 | 4 | 22 | 32 |
| 9 | 2 | 24 | 18 |
| 10 | 1 | 25 | 10 |
| Total | Σf = 25 | Σfx = 171 |
By formula,
Mean = = 6.84
Here, n = 25, which is odd.
Median = th term
= = 13th term.
From table,
Marks obtained by 13th to 18th student = 7.
Median = 7.
From table,
6 marks has highest frequency.
Mode = 6.
Hence, mean = 6.84, median = 7 and mode = 6.
The monthly income of a group of 320 employees in a company is given below :
| Monthly income | No. of employees |
|---|---|
| 6 - 7 | 20 |
| 7 - 8 | 45 |
| 8 - 9 | 65 |
| 9 - 10 | 95 |
| 10 - 11 | 60 |
| 11 - 12 | 30 |
| 12 - 13 | 5 |
Draw an ogive of the given distribution on a graph sheet taking 2 cm = ₹ 1000 on one axis and 2 cm = 50 employees on the other axis. From the graph determine :
(i) the median wage.
(ii) the number of employees whose income is below ₹ 8500.
Answer
(i) Cumulative frequency distribution table :
| Monthly income | No. of employees | Cumulative frequency |
|---|---|---|
| 6 - 7 | 20 | 20 |
| 7 - 8 | 45 | 65 (20 + 45) |
| 8 - 9 | 65 | 130 (65 + 65) |
| 9 - 10 | 95 | 225 (130 + 95) |
| 10 - 11 | 60 | 285 (225 + 60) |
| 11 - 12 | 30 | 315 (285 + 30) |
| 12 - 13 | 5 | 320 (315 + 5) |
Here, n = 320, which is even.
By formula,
Median = th term
= = 160th term.
Steps of construction :
Since, the scale on x-axis starts at 6, a break (kink) is shown near the origin on x-axis to indicate that the graph is drawn to scale beginning at 6.
Take 2 cm along x-axis = 1 thousand rupees.
Take 1 cm along y-axis = 40 employees.
Plot the point (6, 0) as ogive starts from x-axis representing lower limit of first class.
Plot the points (7, 20), (8, 65), (9, 130), (10, 225), (11, 285), (12, 315) and (13, 320).
Join the points by a free hand curve.
Draw a line parallel to x-axis from point M (no. of employees) = 160, touching the graph at point N. From point N draw a line parallel to y-axis touching x-axis at point O.
From graph, O = 9.2 (thousands)
Hence, median wage = ₹ 9200.
(ii) Draw a line parallel to y-axis from point P (income) = ₹ 8.5 (thousands), touching the graph at point Q. From point Q draw a line parallel to x-axis touching y-axis at point R.
From graph, R = 95.
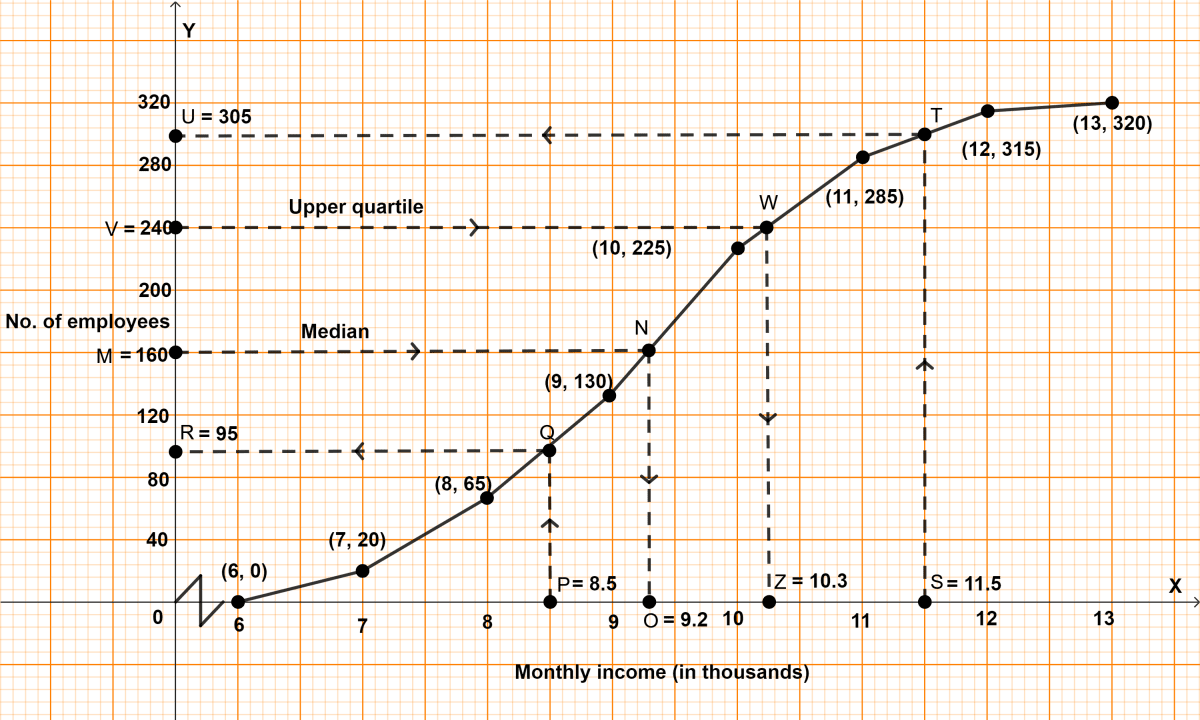
Hence, 95 employees have income less than ₹ 8500.
The mean of numbers 45, 52, 60, x, 69, 70, 26, 81 and 94 is 68. Find the value of x. Hence, estimate the median for the resulting data.
Answer
Sum of observations = 45 + 52 + 60 + x + 69 + 70 + 26 + 81 + 94 = 497 + x
No. of observations (n) = 9
Mean =
68 =
612 = 497 + x
x = 612 - 497 = 115.
Here, n = 9, which is odd.
Median = th term
=
= 5th term
= 69.
Hence, mean = 115 and median = 69.
The marks of 10 students of a class in an examination arranged in ascending order is as follows :
13, 35, 43, 46, x, x + 4, 55, 61, 71, 80.
If the median marks is 48, find the value of x. Hence, find the mode of the given data.
Answer
Here, n = 10, which is even.
By formula,
Given,
Median = 48
⇒ x + 2 = 48
⇒ x = 46.
Set of observations : 13, 35, 42, 46, 46, 50, 55, 61, 71, 80.
Here, 46 has the maximum frequency.
∴ Mode = 46.
Hence, x = 46 and mode = 46.
The histogram below represents the scores obtained by 25 students in a Mathematics mental test. Use the data to :
(i) Frame a frequency distribution table.
(ii) To calculate mean.
(iii) To determine the modal class.

Answer
(i) Frequency distribution table :
| Marks (Class) | No. of students (frequency) |
|---|---|
| 0 - 10 | 2 |
| 10 - 20 | 5 |
| 20 - 30 | 8 |
| 30 - 40 | 4 |
| 40 - 50 | 6 |
(ii) Mean
| Marks (Class) | No. of students (frequency) | Class mean (x) | fx |
|---|---|---|---|
| 0 - 10 | 2 | 5 | 10 |
| 10 - 20 | 5 | 15 | 75 |
| 20 - 30 | 8 | 25 | 200 |
| 30 - 40 | 4 | 35 | 140 |
| 40 - 50 | 6 | 45 | 270 |
| Total | Σf = 25 | Σfx = 695 |
By formula,
Mean =
= = 27.8
Hence, mean = 27.8
(iii) From table,
Class 20 - 30 has the highest frequency.
Hence, modal class = 20 - 30.
For the data given in the following tables, find :
(i) mean
(ii) mode (using graph)
(iii) median (using graph)
(a)
| Class-mark | Frequency |
|---|---|
| 15 | 10 |
| 25 | 12 |
| 35 | 14 |
| 45 | 16 |
| 55 | 8 |
(b)
| Class-mark | Frequency |
|---|---|
| 35 | 8 |
| 40 | 10 |
| 45 | 12 |
| 50 | 15 |
| 55 | 20 |
| 60 | 15 |
Answer
(a) Since the difference between two consecutive class-marks is 10, subtract = 5 from each class-mark to get the lower limit and add 5 to get the upper limit.
| Class-mark (x) | Class interval | Frequency (f) | fx | Cumulative frequency |
|---|---|---|---|---|
| 15 | 10 - 20 | 10 | 150 | 10 |
| 25 | 20 - 30 | 12 | 300 | 22 |
| 35 | 30 - 40 | 14 | 490 | 36 |
| 45 | 40 - 50 | 16 | 720 | 52 |
| 55 | 50 - 60 | 8 | 440 | 60 |
| Total | Σf = 60 | Σfx = 2100 |
(i) By formula,
Mean = = 35.
Hence, mean = 35.
(ii) Calculating mode :
Steps of construction :
Draw a histogram of the given distribution.
Inside the highest rectangle, which represents the maximum frequency (or modal class) draw two lines AC and BD diagonally from the upper corners C and D of adjacent rectangles.
Through the point K (the point of intersection of diagonals AC and BD), draw KM perpendicular to the horizontal axis.
The value of point M on the horizontal axis represents the value of mode.
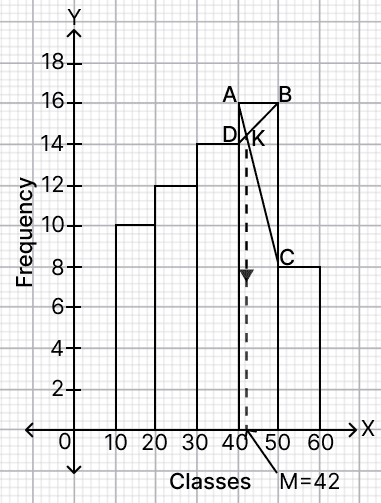
∴ Mode = 42 (approx).
Hence, mode = 42 (approx).
(iii) n = Σf = 60
Median = term = = 30th term.
Steps of construction of ogive :
Take 1 cm = 10 units along x-axis.
Take 1 cm = 10 units along y-axis.
Ogive always starts from a point on x-axis representing the lower limit of the first class. Mark point (10, 0).
Take upper class limits along x-axis and corresponding cumulative frequencies along y-axis, mark the points (20, 10), (30, 22), (40, 36), (50, 52) and (60, 60).
Join the points marked by a free hand curve.
Mark 30 on y-axis, draw a horizontal line which meets the curve at point A.
Through point A, on the curve, draw a vertical line which meets x-axis at point B.
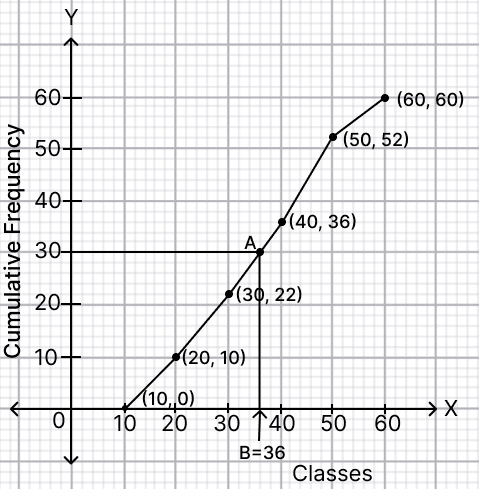
From graph,
B = 36 (approx)
Hence, median = 36 (approx).
(b) Since the difference between two consecutive class-marks is 5, subtract = 2.5 from each class-mark to get the lower limit and add 2.5 to get the upper limit.
| Class-mark (x) | Class interval | Frequency (f) | fx | Cumulative frequency |
|---|---|---|---|---|
| 35 | 32.5 - 37.5 | 8 | 280 | 8 |
| 40 | 37.5 - 42.5 | 10 | 400 | 18 |
| 45 | 42.5 - 47.5 | 12 | 540 | 30 |
| 50 | 47.5 - 52.5 | 15 | 750 | 45 |
| 55 | 52.5 - 57.5 | 20 | 1100 | 65 |
| 60 | 57.5 - 62.5 | 15 | 900 | 80 |
| Total | Σf = 80 | Σfx = 3970 |
(i) By formula,
Mean = = 49.625
Hence, mean = 49.625
(ii) Calculating mode :
Steps of construction :
Draw a histogram of the given distribution.
Inside the highest rectangle, which represents the maximum frequency (or modal class) draw two lines AC and BD diagonally from the upper corners C and D of adjacent rectangles.
Through the point K (the point of intersection of diagonals AC and BD), draw KM perpendicular to the horizontal axis.
The value of point M on the horizontal axis represents the value of mode.
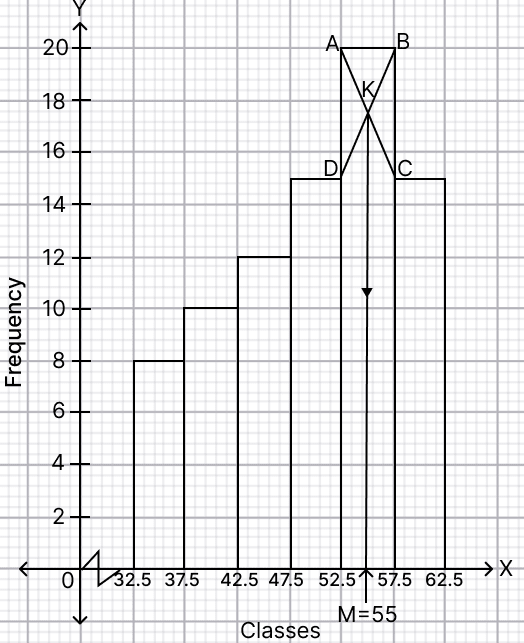
∴ Mode = 55 (approx).
Hence, mode = 55 (approx).
(iii) n = Σf = 80
Median = term = = 40th term.
Steps of construction of ogive :
Take 1 cm = 5 units along x-axis.
Take 1 cm = 10 units along y-axis.
Ogive always starts from a point on x-axis representing the lower limit of the first class. Mark point (32.5, 0).
Take upper class limits along x-axis and corresponding cumulative frequencies along y-axis, mark the points (37.5, 8), (42.5, 18), (47.5, 30), (52.5, 45), (57.5, 65) and (62.5, 80).
Join the points marked by a free hand curve.
Mark 40 on y-axis, draw a horizontal line which meets the curve at point A.
Through point A, on the curve, draw a vertical line which meets x-axis at point B.
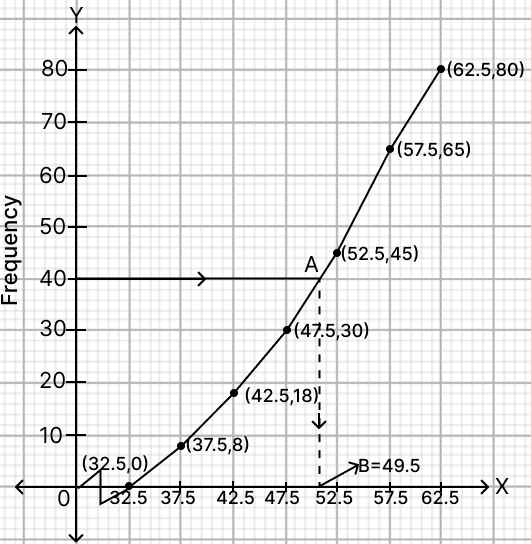
From graph,
B = 49.5 (approx)
Hence, median = 49.5 (approx).