
The median of 18, 29, 15, 14 and 21 is :
15
18
29
21
Answer
Arranging the numbers in ascending order, we get :
14, 15, 18, 21, 29.
The number of terms (n) are 5, which is odd.
∴ Median = th term
Substituting value we get :
Median = = 3rd term = 18.
Hence, Option 2 is the correct option.
The median of 3, 8, 11, 2, 16, 4, 0 and 6 is :
6
9
5
8
Answer
Arranging the numbers in ascending order, we get :
0, 2, 3, 4, 6, 8, 11, 16.
The number of terms (n) are 8, which is even.
∴ Median =
Substituting values we get :
Hence, Option 3 is the correct option.
Numbers 5, 15, 20, x, 28, 30, 35 are in ascending order and have median = 23; then the value of x is :
24
29
17.5
23
Answer
Given, numbers :
5, 15, 20, x, 28, 30, 35
The number of terms (n) are 7, which is odd.
∴ Median = th term
Substituting value we get :
Hence, Option 4 is the correct option.
For numbers 10, 20, 30, 40, 50, 60, 70 and 80; the inter-quartile range is :
20 + 60
60 - 30
60 - 20
50 - 10
Answer
Numbers in ascending order : 10, 20, 30, 40, 50, 60, 70 and 80.
The number of terms (n) are 8, which is even.
∴ Lower quartile = = 2nd term = 20.
∴ Upper quartile = = 6th term = 60.
Inter-quartile = Upper quartile - Lower quartile = 60 - 20.
Hence, Option 3 is the correct option.
From the given diagram, the modal class is :
30 - 40
40 - 50
50 - 60
60 - 70

Answer
From figure,
Class 50-60 has the highest frequency.
Hence, Option 3 is the correct option.
A student got the following marks in 9 questions of a question paper.
3, 5, 7, 3, 8, 0, 1, 4 and 6. Find the median of these marks.
Answer
Arranging the given data in ascending order :
0, 1, 3, 3, 4, 5, 6, 7, 8
Here, n = 9. Since, n is odd.
By formula,
Median = th term.
Substituting values we get,
Median = = 5th term.
Here, 5th term = 4.
Hence, median = 4.
The weights (in kg) of 10 students of a class are given below :
21, 28.5, 20.5, 24, 25.5, 22, 27.5, 28, 21 and 24. Find the median of their weights.
Answer
Arranging the given data in ascending order:
20.5, 21, 21, 22, 24, 24, 25.5, 27.5, 28, 28.5
Here, n = 10, which is even.
By formula,
Median =
Hence, median = 24.
The marks obtained by 19 students of a class are given below :
27, 36, 22, 31, 25, 26, 33, 24, 37, 32, 29, 28, 36, 35, 27, 26, 32, 35 and 28. Find:
(i) Median
(ii) lower quartile
(iii) Upper quartile
(iv) Inter-quartile range
Answer
Arranging in ascending order:
22, 24, 25, 26, 26, 27, 27, 28, 28, 29, 21, 32, 32, 33, 35, 35, 36, 36, 37
(i) Here, n = 19, which is odd.
By formula,
Median = th term.
= = 10th term
= 29.
Hence, median = 29.
(ii) Since, n = 19, which is odd.
By formula,
Lower quartile =
= 5th term = 26.
Hence, lower quartile = 26.
(iii) Since, n = 19, which is odd.
By formula,
Upper quartile =
= 15th term = 35.
Hence, upper quartile = 35.
(iv) Inter quartile range = Upper quartile - Lower quartile
= 35 - 26
= 9.
Hence, inter quartile range = 9.
The weight of 60 boys are given in the following distribution table :
| Weight (kg) | No. of boys |
|---|---|
| 37 | 10 |
| 38 | 14 |
| 39 | 18 |
| 40 | 12 |
| 41 | 6 |
Find :
(i) Median
(ii) Lower quartile
(iii) Upper quartile
(iv) Inter quartile range.
Answer
Cumulative frequency distribution table :
| Weight (kg) | No. of boys (f) | Cumulative frequency |
|---|---|---|
| 37 | 10 | 10 |
| 38 | 14 | 24 (10 + 14) |
| 39 | 18 | 42 (24 + 18) |
| 40 | 12 | 54 (42 + 12) |
| 41 | 6 | 60 (6 + 54) |
(i) Here, n = 60, which is even.
By formula,
Median =
Substituting values we get :
Median =
From table,
The weight of each boy from 25th to 42nd is 39 kg.
∴ 30th term and 31st term = 39
Substituting value to get median :
Median = = 39 kg.
(ii) Here, n = 60, which is even.
By formula,
Lower quartile = th term
= = 15th term.
From table,
The weight of each boy from 11th to 24th term is 38 kg.
Hence, lower quartile = 38.
(iii) Here, n = 60, which is even.
By formula,
Upper quartile = th term
= = 45th term.
From table,
The weight of each boy from 43rd to 54th is 40 kg.
Hence, upper quartile = 40.
(iv) Inter quartile range = Upper quartile - Lower quartile
= 40 - 38
= 2.
Hence, inter-quartile range = 2.
From the following cumulative frequency table draw ogive and then use it to find :
(i) Median
(ii) Lower quartile
(iii) Upper quartile
| Marks (less than) | Cumulative frequency |
|---|---|
| 10 | 5 |
| 20 | 24 |
| 30 | 37 |
| 40 | 40 |
| 50 | 42 |
| 60 | 48 |
| 70 | 70 |
| 80 | 77 |
| 90 | 79 |
| 100 | 80 |
Answer
Cumulative frequency distribution table :
| Marks | Cumulative frequency |
|---|---|
| 0 - 10 | 5 |
| 10 - 20 | 24 |
| 20 - 30 | 37 |
| 30 - 40 | 40 |
| 40 - 50 | 42 |
| 50 - 60 | 48 |
| 60 - 70 | 70 |
| 70 - 80 | 77 |
| 80 - 90 | 79 |
| 90 - 100 | 80 |
Here, n = 80, which is even.
By formula,
Median = th term
= = 40th term.
Lower quartile = th term
= = 20th term.
Upper quartile = th term
= = 60th term.
Steps of construction of ogive :
Take 1 cm = 10 units on x-axis.
Take 1 cm = 10 units on y-axis.
Plot the point (0, 0), as ogive always starts on x-axis representing the lower limit of the first class.
Plot the points (10, 5), (20, 24), (30, 37), (40, 40), (50, 42), (60, 48), (70, 70), (80, 77), (90, 79) and (100, 80).
Join the points by a free hand curve.
Draw a line parallel to x-axis from point L (frequency) = 40, touching the graph at point T. From point T draw a line parallel to y-axis touching x-axis at point M.
Draw a line parallel to x-axis from point N (frequency) = 20, touching the graph at point O. From point O draw a line parallel to y-axis touching x-axis at point P.
Draw a line parallel to x-axis from point Q (frequency) = 60, touching the graph at point R. From point R draw a line parallel to y-axis touching x-axis at point S.
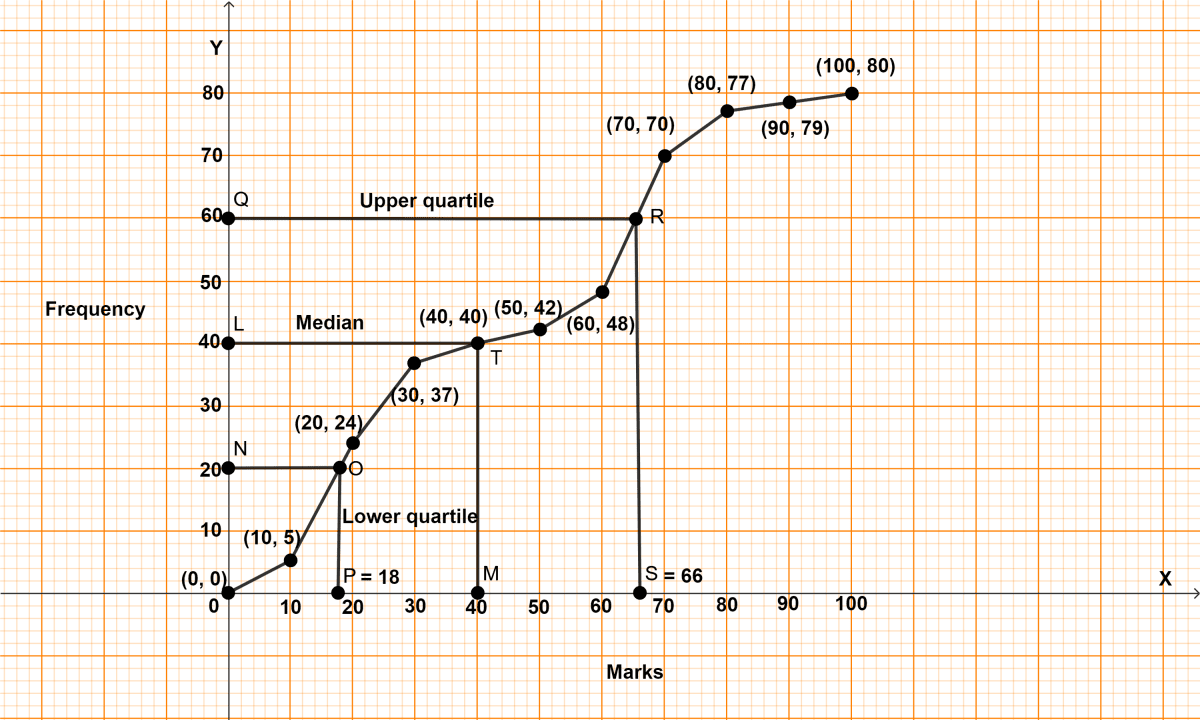
(i) From graph, M = 40
Hence, median = 40.
(ii) From graph, P = 18
Hence, lower quartile = 18.
(iii) From graph, S = 66
Hence, upper quartile = 66.
In a school, 100 pupils have heights as tabulated below :
| Height (in cm) | No. of pupils |
|---|---|
| 121 - 130 | 12 |
| 131 - 140 | 16 |
| 141 - 150 | 30 |
| 151 - 160 | 20 |
| 161 - 170 | 14 |
| 171 - 180 | 8 |
Find the median height by drawing an ogive.
Answer
The above distribution is discontinuous, converting into continuous distribution, we get :
Adjustment factor = (Lower limit of one class - Upper limit of previous class) / 2
=
= 0.5
Subtract the adjustment factor (0.5) from all the lower limits and add the adjustment factor (0.5) to all the upper limits.
| Classes before adjustment | Classes after adjustment | No. of pupils | Cumulative frequency |
|---|---|---|---|
| 121 - 130 | 120.5 - 130.5 | 12 | 12 |
| 131 - 140 | 130.5 - 140.5 | 16 | 28 (12 + 16) |
| 141 - 150 | 140.5 - 150.5 | 30 | 58 (28 + 30) |
| 151 - 160 | 150.5 - 160.5 | 20 | 78 (58 + 20) |
| 161 - 170 | 160.5 - 170.5 | 14 | 92 (78 + 14) |
| 171 - 180 | 170.5 - 180.5 | 8 | 100 (92 + 8) |
Here, n = 100 which is even.
By formula,
Median = = 50th term.
Steps of construction of ogive :
Since, the scale on x-axis starts at 120.5, a break (kink) is shown near the origin on x-axis to indicate that the graph is drawn to scale beginning at 120.5.
Take 2 cm along x-axis = 10 units.
Take 1 cm along y-axis = 10 units.
Plot the point (120.5, 0), as ogive always starts on x-axis representing the lower limit of the first class.
Plot the points (130.5, 12), (140.5, 28), (150.5, 58), (160.5, 78), (170.5, 92) and (180.5, 100).
Join the points by a free hand curve.
Draw a line parallel to x-axis from point A (frequency) = 50, touching the graph at point B. From point B draw a line parallel to y-axis touching x-axis at point C.
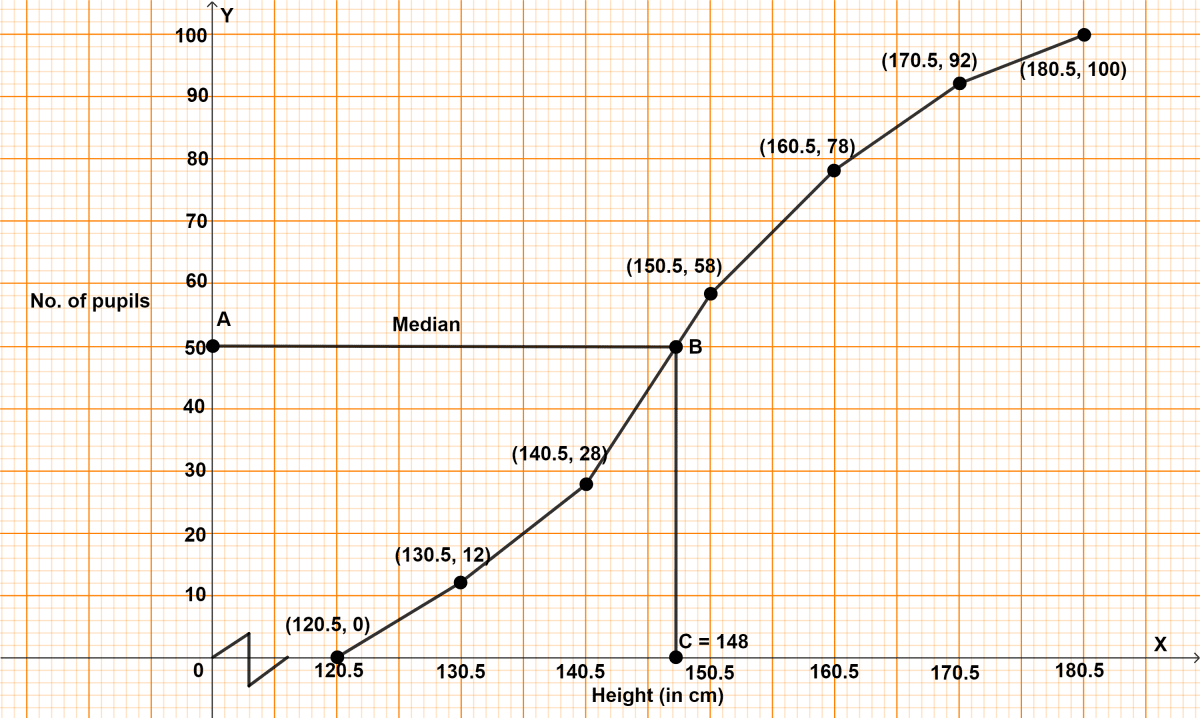
From graph, C = 148 cm
Hence, median = 148 cm.
Find the mode of following data, using a histogram :
| Class | Frequency |
|---|---|
| 0 - 10 | 5 |
| 10 - 20 | 12 |
| 20 - 30 | 20 |
| 30 - 40 | 9 |
| 40 - 50 | 4 |
Answer
Steps :
Draw a histogram of the given distribution.
Inside the highest rectangle, which represents the maximum frequency (or modal class), draw two lines AC and BD diagonally from the upper corners C and D of adjacent rectangles.
Through point K (the point of intersection of diagonals AC and BD), draw KL perpendicular to the horizontal axis.
The value of point L on the horizontal axis represents the value of mode.
∴ Mode = 24.

Hence, mode = 24.
The following table shows the expenditure of 60 boys on books. Find the mode of their expenditure.
| Expenditure (₹) | No. of students |
|---|---|
| 20 - 25 | 4 |
| 25 - 30 | 7 |
| 30 - 35 | 23 |
| 35 - 40 | 18 |
| 40 - 45 | 6 |
| 45 - 50 | 2 |
Answer
Steps :
Draw a histogram of the given distribution.
Inside the highest rectangle, which represents the maximum frequency (or modal class), draw two lines MJ and LO diagonally from the upper corners M and L of adjacent rectangles.
Through point Z (the point of intersection of diagonals MJ and LO), draw ZP perpendicular to the horizontal axis.
The value of point P on the horizontal axis represents the value of mode.
∴ Mode = 34.

Hence, mode = 34.
A boy scored the following marks in various class tests during a term, each test being marked out of 20.
15, 17, 16, 7, 10, 12, 14, 16, 19, 12 and 16.
(i) What are his modal marks ?
(ii) What are his median marks ?
(iii) What are his total marks ?
(iv) What are his mean marks ?
Answer
(i) From above data,
16 occurs for the maximum time.
Hence, mode = 16.
(ii) Arranging the numbers in ascending order :
7, 10, 12, 12, 14, 15, 16, 16, 16, 17, 19.
Here, n = 11, which is odd.
By formula,
Median = th term
=
= 6th term
= 15.
Hence, median = 15.
(iii) Total marks = 7 + 10 + 12 + 12 + 14 + 15 + 16 + 16 + 16 + 17 + 19
= 154.
Hence, total marks = 154.
(iv) Mean =
=
= 14.
Hence, mean = 14.
At a shooting competition the scores of a competitor were as given below :
| Score | No. of shots |
|---|---|
| 0 | 0 |
| 1 | 3 |
| 2 | 6 |
| 3 | 4 |
| 4 | 7 |
| 5 | 5 |
(i) What was his modal score ?
(ii) What was his median score ?
(iii) What was his total score ?
(iv) What was his mean score ?
Answer
(i) From above table,
The score 4 has the maximum frequency.
Hence, modal score = 4.
(ii) Cumulative frequency distribution table :
| Score (x) | No. of shots (f) | Cumulative frequency | fx |
|---|---|---|---|
| 0 | 0 | 0 | 0 |
| 1 | 3 | 3 (0 + 3) | 3 |
| 2 | 6 | 9 (3 + 6) | 12 |
| 3 | 4 | 13 (9 + 4) | 12 |
| 4 | 7 | 20 (13 + 7) | 28 |
| 5 | 5 | 25 (20 + 5) | 25 |
| Total | 25 | 80 |
Here, n = 25, which is odd.
By formula,
Median = th term = = 13th term
From table, score of 10th to 13th term is 3.
Hence, median = 3.
(iii) From cumulative frequency distribution table we get,
Total score = 80.
Hence, total score = 80.
(iv) By formula,
Mean = = 3.2
Hence, mean = 3.2