
From the given table the values of a, b and c are :
| C.I. | Frequency | Cumulative Frequency |
|---|---|---|
| 30-40 | 24 | 24 |
| 40-50 | a | 40 |
| 50-60 | 12 | b |
| 60-70 | c | 60 |
a = 16, b = 52 and c = 8
a = 16, b = 12 and c = 8
a = 40, b = 52 and c = 60
a = 40, b = 12 and c = 60
Answer
From table,
⇒ 24 + a = 40
⇒ a = 40 - 24 = 16
⇒ b = 40 + 12 = 52
⇒ b + c = 60
⇒ 52 + c = 60
⇒ c = 60 - 52 = 8.
Hence, Option 1 is the correct option.
The cumulative frequency of the class 70-90 is :
80
120
180
40

Answer
From the graph, we form the cumulative frequency table :
| Class | Frequency | Cumulative frequency |
|---|---|---|
| 30-50 | 50 | 50 |
| 50-70 | 30 | 80 (50 + 30) |
| 70-90 | 40 | 120 (80 + 40) |
| 90-110 | 60 | 180 (120 + 60) |
Hence, Option 2 is the correct option.
For the given frequency distribution, the adjustment factor is :
| C.I. | f |
|---|---|
| 30-34 | 8 |
| 34-38 | 10 |
| 38-42 | 8 |
0
34 + 38
Answer
By formula,
Adjustment factor =
The given classes (30-34, 34-38, 38-42) are already in continuous (exclusive) form, as the upper limit of each class is equal to the lower limit of the next class.
⇒ Adjustment factor = .
Hence, Option 3 is the correct option.
The cumulative frequency curve for a frequency distribution starts from :
0
lower limit of 1st class
Answer
The cumulative frequency curve for a frequency distribution starts from lower limit of 1st class.
Hence, Option 3 is the correct option.
The cumulative frequency curve for a frequency distribution terminates at :
100
upper limit of last class
Answer
The cumulative frequency curve for a frequency distribution terminates at upper limit of last class.
Hence, Option 4 is the correct option.
Draw histograms for the following frequency distributions :
| Class interval | Frequency |
|---|---|
| 0 - 10 | 12 |
| 10 - 20 | 20 |
| 20 - 30 | 26 |
| 30 - 40 | 18 |
| 40 - 50 | 10 |
| 50 - 60 | 6 |
Answer
Steps of construction of histogram :
Take 2 cm along x-axis = 10 units.
Take 1 cm along y-axis = 5 units.
Construct rectangles corresponding to the above continuous frequency distribution table.
The required histogram is shown in the below figure:

Draw histograms for the following frequency distributions :
| Class interval | Frequency |
|---|---|
| 10 - 16 | 15 |
| 16 - 22 | 23 |
| 22 - 28 | 30 |
| 28 - 34 | 20 |
| 34 - 40 | 16 |
Answer
Steps of construction of histogram :
Since, the scale on x-axis starts at 10, a break (kink) is shown near the origin on x-axis to indicate that the graph is drawn to scale beginning at 10.
Take 2 cm along x-axis = 6 units.
Take 1 cm along y-axis = 5 units.
Construct rectangles corresponding to the above continuous frequency distribution table.
The required histogram is shown in the below figure:

Draw histograms for the following frequency distributions :
| Class mark | Frequency |
|---|---|
| 16 | 8 |
| 24 | 12 |
| 32 | 15 |
| 40 | 18 |
| 48 | 25 |
| 56 | 19 |
| 64 | 10 |
Answer
Since, the difference between the values of any two consecutive class marks is 8 (24 - 16).
Therefore, subtract = 4, from each class mark to get the lower limit of the corresponding class interval and add 4 to each class mark to get the upper limit.
Frequency distribution table :
| Class mark | Class | Frequency |
|---|---|---|
| 16 | 12 - 20 | 08 |
| 24 | 20 - 28 | 12 |
| 32 | 28 - 36 | 15 |
| 40 | 36 - 44 | 18 |
| 48 | 44 - 52 | 25 |
| 56 | 52 - 60 | 19 |
| 64 | 60 - 68 | 10 |
Steps of construction of histogram :
Since, the scale on x-axis starts at 12, a break (kink) is shown near the origin on x-axis to indicate that the graph is drawn to scale beginning at 12.
Take 1 cm along x-axis = 8 units.
Take 1 cm along y-axis = 5 units.
Construct rectangles corresponding to the above continuous frequency distribution table.
The required histogram is shown in the below figure:

Draw a cumulative frequency curve (ogive) for the following distributions :
| Class Interval | Frequency |
|---|---|
| 10 - 15 | 10 |
| 15 - 20 | 15 |
| 20 - 25 | 17 |
| 25 - 30 | 12 |
| 30 - 35 | 10 |
| 35 - 40 | 8 |
Answer
The cumulative frequency distribution :
| Class Interval | Frequency | Cumulative frequency |
|---|---|---|
| 10 - 15 | 10 | 10 |
| 15 - 20 | 15 | 25 (10 + 15) |
| 20 - 25 | 17 | 42 (25 + 17) |
| 25 - 30 | 12 | 54 (42 + 12) |
| 30 - 35 | 10 | 64 (54 + 10) |
| 35 - 40 | 8 | 72 (64 + 8) |
Steps of construction of ogive :
Take 2 cm = 5 units along x-axis.
Take 1 cm = 10 units along y-axis.
Ogive always starts from a point on x-axis representing the lower limit of the first class. Mark point (10, 0).
Take upper class limits along x-axis and corresponding cumulative frequencies along y-axis, mark the points (15, 10), (20, 25), (25, 42), (30, 54), (35, 64) and (40, 72).
Join the points marked by a free hand curve.
The required ogive is shown in the below figure:

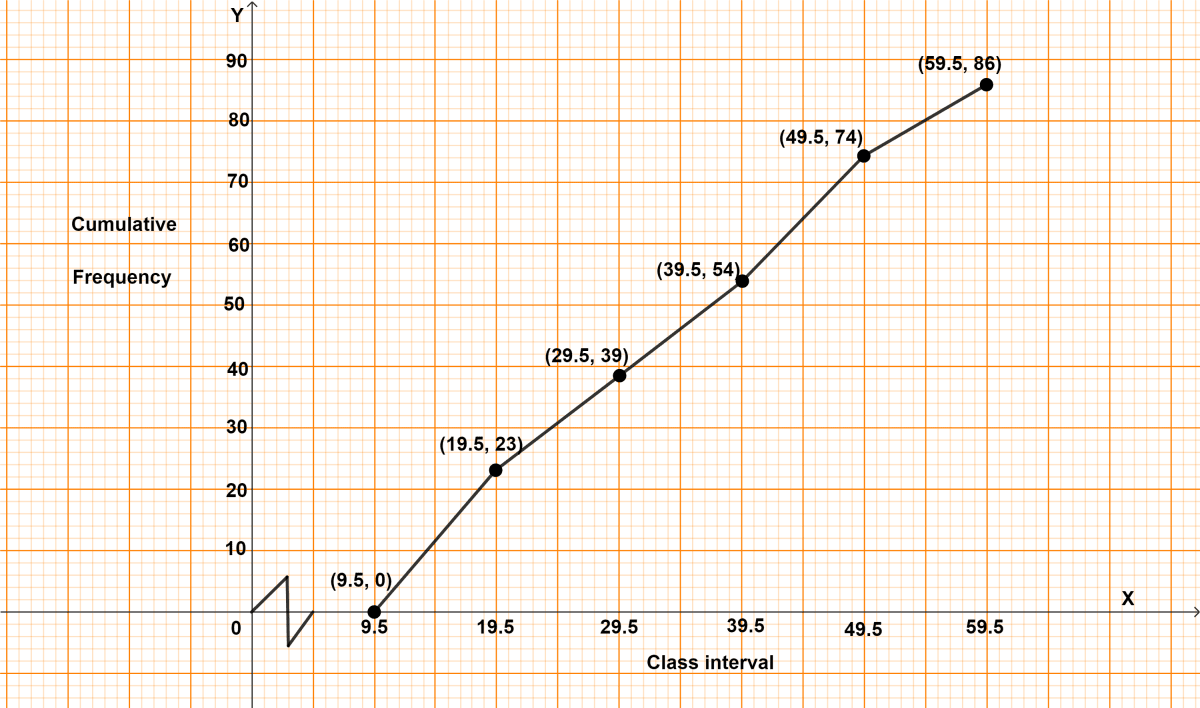
Draw a cumulative frequency curve (ogive) for the following distributions :
| Class interval | Frequency |
|---|---|
| 10 - 19 | 23 |
| 20 - 29 | 16 |
| 30 - 39 | 15 |
| 40 - 49 | 20 |
| 50 - 59 | 12 |
Answer
The above distribution is discontinuous converting into continuous distribution, we get :
Adjustment factor = (Lower limit of one class - Upper limit of previous class) / 2
=
= 0.5
Subtract the adjustment factor (0.5) from all the lower limits and add the adjustment factor (0.5) to all the upper limits.
| Classes before adjustment | Classes after adjustment | Frequency | Cumulative frequency |
|---|---|---|---|
| 10 - 19 | 9.5 - 19.5 | 23 | 23 |
| 20 - 29 | 19.5 - 29.5 | 16 | 39 (23 + 16) |
| 30 - 39 | 29.5 - 39.5 | 15 | 54 (39 + 15) |
| 40 - 49 | 39.5 - 49.5 | 20 | 74 (54 + 20) |
| 50 - 59 | 49.5 - 59.5 | 12 | 86 (74 + 12) |
Steps of construction of ogive :
Since, the scale on x-axis starts at 9.5, a break (kink) is shown near the origin on x-axis to indicate that the graph is drawn to scale beginning at 9.5.
Take 2 cm = 10 units along x-axis.
Take 1 cm = 10 units along y-axis.
Ogive always starts from a point on x-axis representing the lower limit of the first class. Mark point (9.5, 0).
Take upper class limits along x-axis and corresponding cumulative frequencies along y-axis, mark the points (19.5, 23), (29.5, 39), (39.5, 54), (49.5, 74) and (59.5, 86).
Join the points marked by a free hand curve.
The required ogive is shown in the below figure:
Draw an ogive for the following distribution :
| Marks obtained | No. of students |
|---|---|
| less than 10 | 8 |
| less than 20 | 25 |
| less than 30 | 38 |
| less than 40 | 50 |
| less than 50 | 67 |
Answer
Cumulative frequency distribution table :
| Marks obtained | Class interval | No. of students (Cumulative frequency) |
|---|---|---|
| less than 10 | 0 - 10 | 8 |
| less than 20 | 10 - 20 | 25 |
| less than 30 | 20 - 30 | 38 |
| less than 40 | 30 - 40 | 50 |
| less than 50 | 40 - 50 | 67 |
Steps of construction of ogive :
Take 2 cm = 10 units along x-axis.
Take 1 cm = 10 units along y-axis.
Ogive always starts from a point on x-axis representing the lowest limit. Mark point (0, 0).
Take upper class limits along x-axis corresponding cumulative frequencies along y-axis, mark the points (10, 8), (20, 25), (30, 38), (40, 50) and (50, 67).
Join the points marked by a free hand curve.
The required ogive is shown in the below figure:

Draw an ogive for the following distribution :
| Age in years (less than) | Cumulative frequency |
|---|---|
| 10 | 0 |
| 20 | 17 |
| 30 | 32 |
| 40 | 37 |
| 50 | 53 |
| 60 | 58 |
| 70 | 65 |
Answer
Cumulative frequency distribution table :
| Age in years (less than) | Cumulative frequency |
|---|---|
| 10 | 0 |
| 20 | 17 |
| 30 | 32 |
| 40 | 37 |
| 50 | 53 |
| 60 | 58 |
| 70 | 65 |
Steps of construction of ogive :
Take 2 cm = 10 units along x-axis.
Take 1 cm = 10 units along y-axis.
Ogive always starts from a point on x-axis representing the lowest limit. Mark point (0, 0).
Take upper class limits along x-axis corresponding cumulative frequencies along y-axis, mark the points (10, 0), (20, 17), (30, 32), (40, 37), (50, 53), (60, 58) and (70, 65).
Join the points marked by a free hand curve.
The required ogive is shown in the adjoining figure.

(a) Use the information given in the adjoining histogram to construct a frequency table.
(b) Use this table to construct an ogive.

Answer
(a) The cumulative frequency table for above distribution is :
| Class interval | Frequency | Cumulative frequency |
|---|---|---|
| 8 - 12 | 9 | 9 |
| 12 - 16 | 16 | 25 |
| 16 - 20 | 22 | 47 |
| 20 - 24 | 18 | 65 |
| 24 - 28 | 12 | 77 |
| 28 - 32 | 4 | 81 |
(b) Steps of construction of ogive :
Since, the scale on x-axis starts at 8, a break (kink) is shown near the origin on x-axis to indicate that the graph is drawn to scale beginning at 8.
Take 2 cm = 4 units along x-axis.
Take 1 cm = 10 units along y-axis.
Ogive always starts from a point on x-axis representing the lowest limit. Mark point (8, 0).
Take upper class limits along x-axis corresponding cumulative frequencies along y-axis, mark the points (12, 9), (16, 25), (20, 47), (24, 65), (28, 77) and (32, 81).
Join the points marked by a free hand curve.
The required ogive is shown in the adjoining figure.

Use graph paper for this question.
The table given below shows the monthly wages of some factory workers.
(i) Using the table, calculate the cumulative frequencies of workers.
(ii) Draw a cumulative frequency curve.
| Wages (in ₹) | No. of workers |
|---|---|
| 6500 - 7000 | 10 |
| 7000 - 7500 | 18 |
| 7500 - 8000 | 22 |
| 8000 - 8500 | 25 |
| 8500 - 9000 | 17 |
| 9000 - 9500 | 10 |
| 9500 - 10000 | 8 |
Answer
(i) The cumulative frequency distribution table is as follows :
| Wages (in ₹) | No. of workers | Cumulative frequency |
|---|---|---|
| 6500 - 7000 | 10 | 10 |
| 7000 - 7500 | 18 | 28 (10 + 18) |
| 7500 - 8000 | 22 | 50 (28 + 22) |
| 8000 - 8500 | 25 | 75 (50 + 25) |
| 8500 - 9000 | 17 | 92 (75 + 17) |
| 9000 - 9500 | 10 | 102 (92 + 10) |
| 9500 - 10000 | 8 | 110 (102 + 8) |
(ii) Steps for construction of cumulative frequency curve :
Since, the scale on x-axis starts at 6500, a break (kink) is shown near the origin on x-axis to indicate that the graph is drawn to scale beginning at 6500.
Take 2 cm along x-axis = ₹ 500.
Take 1 cm along y-axis = 10 workers.
Ogive always starts from a point on x-axis representing the lower limit of first class. Mark point (6500, 0).
Take upper class limits along x-axis, corresponding cumulative frequencies along y-axis, mark the points (7000, 10), (7500, 28), (8000, 50), (8500, 75), (9000, 92), (9500, 102) and (10000, 110).
Join the points marked by a free hand curve.
The required ogive is shown in the below figure:

The following table shows the distribution of the heights of a group of factory workers :
| Ht. (cm) | No. of workers |
|---|---|
| 150 - 155 | 6 |
| 155 - 160 | 12 |
| 160 - 165 | 18 |
| 165 - 170 | 20 |
| 170 - 175 | 13 |
| 175 - 180 | 8 |
| 180 - 185 | 6 |
(i) Determine the cumulative frequencies.
(ii) Draw the 'less than' cumulative frequency curve on graph paper.
Answer
(i) The cumulative frequency distribution table is as follows :
| Ht. (cm) | No. of workers | Cumulative frequency |
|---|---|---|
| 150 - 155 | 6 | 6 |
| 155 - 160 | 12 | 18 (6 + 12) |
| 160 - 165 | 18 | 36 (18 + 18) |
| 165 - 170 | 20 | 56 (36 + 20) |
| 170 - 175 | 13 | 69 (56 + 13) |
| 175 - 180 | 8 | 77 (69 + 8) |
| 180 - 185 | 6 | 83 (77 + 6) |
(ii) Steps for construction of 'less than' cumulative frequency curve :
Since, the scale on x-axis starts at 150, a break (kink) is shown near the origin on x-axis to indicate that the graph is drawn to scale beginning at 150.
Take 2 cm along x-axis = 5 cm.
Take 1 cm along y-axis = 10 workers.
Ogive always starts from a point on x-axis representing the lower limit of first class. Mark point (150, 0).
Take upper class limits along x-axis, corresponding cumulative frequencies along y-axis, mark the points (155, 6), (160, 18), (165, 36), (170, 56), (175, 69), (180, 77) and (185, 83).
Join the points marked by a free hand curve.
The required ogive is shown in the below figure:

Construct a frequency distribution table for the following distribution :
| Marks (less than) | Cumulative frequency |
|---|---|
| 0 | 0 |
| 10 | 7 |
| 20 | 28 |
| 30 | 54 |
| 40 | 71 |
| 50 | 84 |
| 60 | 105 |
| 70 | 147 |
| 80 | 180 |
| 90 | 196 |
| 100 | 200 |
Answer
The frequency distribution table for above distribution is :
| Marks | Cumulative frequency | Frequency |
|---|---|---|
| 0 - 10 | 7 | 7 |
| 10 - 20 | 28 | 21 (28 - 7) |
| 20 - 30 | 54 | 26 (54 - 28) |
| 30 - 40 | 71 | 17 (71 - 54) |
| 40 - 50 | 84 | 13 (84 - 71) |
| 50 - 60 | 105 | 21 (105 - 84) |
| 60 - 70 | 147 | 42 (147 - 105) |
| 70 - 80 | 180 | 33 (180 - 147) |
| 80 - 90 | 196 | 16 (196 - 180) |
| 90 - 100 | 200 | 4 (200 - 196) |
Construct a frequency distribution table for the following distribution :
| Marks (more than) | Cumulative frequency |
|---|---|
| 0 | 100 |
| 10 | 87 |
| 20 | 65 |
| 30 | 55 |
| 40 | 42 |
| 50 | 36 |
| 60 | 31 |
| 70 | 21 |
| 80 | 18 |
| 90 | 7 |
| 100 | 0 |
Answer
The frequency distribution table for above distribution is :
| Marks | Cumulative frequency | Frequency |
|---|---|---|
| 0 - 10 | 100 | 13 (100 - 87) |
| 10 - 20 | 87 | 22 (87 - 65) |
| 20 - 30 | 65 | 10 (65 - 55) |
| 30 - 40 | 55 | 13 (55 - 42) |
| 40 - 50 | 42 | 6 (42 - 36) |
| 50 - 60 | 36 | 5 (36 - 31) |
| 60 - 70 | 31 | 10 (31 - 21) |
| 70 - 80 | 21 | 3 (21 - 18) |
| 80 - 90 | 18 | 11 (18 - 7) |
| 90 - 100 | 7 | 7 |