
The mean of 5 variables is 20. If four of them are 15, 25, 10 and 12; the fifth variable is :
38
60
48
28
Answer
Let fifth variable be x.
By formula,
Mean =
Hence, Option 1 is the correct option.
The mean height of 5 students is 140 cm. If height of one student is 156 cm, the mean height of remaining students is :
74 cm
136 cm
16 cm
80 cm
Answer
By formula,
Mean =
Given,
The mean height of 5 students is 140 cm.
Given,
Height of one student is 156 cm, so total height of remaining students = 700 - 156 = 544 cm.
Mean height of remaining (4) students = = 136 cm.
Hence, Option 2 is the correct option.
The mean age of eight boys is 16 years. If two more boys, with ages 18 years and 14 years, join them, the resulting mean age is :
18 years
14 years
16 years
32 years
Answer
By formula,
Mean =
Given,
The mean age of eight boys is 16 years.
Given,
Two more boys with ages 18 years and 14 years join the group.
Total age now = 128 + 18 + 14 = 160.
New mean age = = 16 years.
Hence, Option 3 is the correct option.
The mean value of 15 numbers is 20. If one of these numbers is wrongly taken as 45 instead of 15, the correct mean is :
30
15
20
18
Answer
By formula,
Mean =
Given, the mean value of 15 numbers is 20.
Given,
One of these numbers is wrongly taken as 45 instead of 15.
Correct sum of observations = 300 - 45 + 15 = 270.
Hence, Option 4 is the correct option.
The mean of the given frequency distribution is :
| x | f |
|---|---|
| 30 | 15 |
| 20 | 5 |
= 27.5
= 2.5
Answer
| x | f | fx |
|---|---|---|
| 30 | 15 | 450 |
| 20 | 5 | 100 |
| Total | Σf = 20 | Σfx = 550 |
By formula,
Mean = = 27.5
Hence, Option 3 is the correct option.
Marks obtained (in mathematics) by 9 students are given below :
60, 67, 52, 76, 50, 51, 74, 45 and 56.
(a) Find the arithmetic mean.
(b) If marks of each student be increased by 4; what will be the new value of arithmetic mean?
Answer
(a) Sum of observations = 60 + 67 + 52 + 76 + 50 + 51 + 74 + 45 + 56 = 531.
By formula,
Mean =
= = 59.
Hence, mean = 59.
(b) We know that,
If each given number is increased or decreased by the same quantity, the value of mean is also increased or decreased by same quantity.
∴ If marks of each student is increased by 4, then mean will also increase by 4.
New mean = 59 + 4 = 63.
Hence, new mean = 63.
(a) Find the mean of 7, 11, 6, 5 and 6.
(b) If each number given in (a) is diminished by 2; find the new value of mean.
Answer
(a) Sum of observations = 7 + 11 + 6 + 5 + 6 = 35.
By formula,
Mean =
= = 7.
Hence, mean = 7.
(b) We know that,
If each given number is increased or decreased by the same quantity, the value of mean is also increased or decreased by same quantity.
∴ If each number is diminished by 2, then mean will also decrease by 2.
New mean = 7 - 2 = 5.
Hence, new mean = 5.
If the mean of 6, 4, 7, a and 10 is 8, find the value of 'a'.
Answer
Sum of observations = 6 + 4 + 7 + a + 10 = a + 27.
By formula,
Mean =
⇒ 8 =
⇒ 40 = a + 27
⇒ a = 13.
Hence, the value of a = 13.
The mean of the number 6, y, 7, x and 14 is 8. Express y in terms of x.
Answer
Sum of observations = 6 + y + 7 + x + 14 = x + y + 27.
By formula,
Mean =
⇒ 8 =
⇒ 40 = x + y + 27
⇒ x + y = 40 - 27
⇒ x + y = 13
⇒ y = 13 - x.
Hence, y = 13 - x.
The ages of 40 students are given in the following table :
| Age (in years) | Frequency |
|---|---|
| 12 | 2 |
| 13 | 4 |
| 14 | 6 |
| 15 | 9 |
| 16 | 8 |
| 17 | 7 |
| 18 | 4 |
Find the arithmetic mean.
Answer
| Age (x) | Frequency (f) | fx |
|---|---|---|
| 12 | 2 | 24 |
| 13 | 4 | 52 |
| 14 | 6 | 84 |
| 15 | 9 | 135 |
| 16 | 8 | 128 |
| 17 | 7 | 119 |
| 18 | 4 | 72 |
| Total | Σf = 40 | Σfx = 614 |
We know that,
n = Σf = 40.
By formula,
Mean = = 15.35
Hence, arithmetic mean = 15.35
If 69.5 is the mean of 72, 70, x, 62, 50, 71, 90, 64, 58 and 82 : find the value of x.
Answer
Sum of observations : 72 + 70 + x + 62 + 50 + 71 + 90 + 64 + 58 + 82 = 619 + x.
By formula,
Mean =
⇒ 69.5 =
⇒ 695 = x + 619
⇒ x = 695 - 619
⇒ x = 76.
Hence, x = 76.
The following table gives the heights of plants in centimeter. If the mean height of plants is 60.95 cm; find the value of 'f'.
| Height (cm) | No. of plants |
|---|---|
| 50 | 2 |
| 55 | 4 |
| 58 | 10 |
| 60 | f |
| 65 | 5 |
| 70 | 4 |
| 71 | 3 |
Answer
| Height (x) | No. of plants (f) | fx |
|---|---|---|
| 50 | 2 | 100 |
| 55 | 4 | 220 |
| 58 | 10 | 580 |
| 60 | f | 60f |
| 65 | 5 | 325 |
| 70 | 4 | 280 |
| 71 | 3 | 213 |
| Total | Σf = 28 + f | Σfx = 1718 + 60f |
We know that,
n = Σf = 28 + f
By formula,
⇒ Mean =
⇒ 60.95 =
⇒ 60.95(28 + f) = 1718 + 60f
⇒ 1706.6 + 60.95f = 1718 + 60f
⇒ 60.95f - 60f = 1718 - 1706.6
⇒ 0.95f = 11.4
⇒ f = = 12.
Hence, f = 12.
From the data, given below, calculate the mean wage, correct to the nearest rupee.
| Category | Wages in ₹/day | No. of workers |
|---|---|---|
| A | 50 | 2 |
| B | 60 | 4 |
| C | 70 | 8 |
| D | 80 | 12 |
| E | 90 | 10 |
| F | 100 | 6 |
(i) If the number of workers in each category is doubled, what would be the new mean wage ?
(ii) If the wages per day in each category are increased by 60%; what is the new mean wage ?
(iii) If the number of workers in each category is doubled and the wages per day per worker are reduced by 40%; what would be the new mean wage ?
Answer
| Category | Wages in ₹/day (x) | No. of workers (f) | fx |
|---|---|---|---|
| A | 50 | 2 | 100 |
| B | 60 | 4 | 240 |
| C | 70 | 8 | 560 |
| D | 80 | 12 | 960 |
| E | 90 | 10 | 900 |
| F | 100 | 6 | 600 |
| Total | 42 | 3360 |
Mean = = 80.
(i) Original mean =
If no. of workers is doubled, then
New mean = = original mean.
∴ If the numbers of workers in each category is doubled, then new mean wage will remain same.
Hence, mean = 80.
(ii) If the wages per day in each category are increased by 60% then new mean wage also increases by 60%.
New mean = 80 +
= 80 + 48 = 128.
Hence, new mean = 128.
(iii) There will be no change in mean due to change in number of workers.
If wages is reduced by 40% then, mean will also reduce by 40%.
New mean = 80 -
= 80 - 32
= 48.
Hence, new mean = 48.
The contents of 100 match boxes were checked to determine the number of matches they contained.
| No. of matches | No. of boxes |
|---|---|
| 35 | 6 |
| 36 | 10 |
| 37 | 18 |
| 38 | 25 |
| 39 | 21 |
| 40 | 12 |
| 41 | 8 |
(i) Calculate, correct to one decimal place, the mean number of matches per box.
(ii) Determine, how many extra matches would have to be added to the total contents of the 100 boxes to bring the mean up to exactly 39 matches ?
Answer
(i)
| No. of matches (x) | No. of boxes (f) | fx |
|---|---|---|
| 35 | 6 | 210 |
| 36 | 10 | 360 |
| 37 | 18 | 666 |
| 38 | 25 | 950 |
| 39 | 21 | 819 |
| 40 | 12 | 480 |
| 41 | 8 | 328 |
| Total | 100 | 3813 |
By formula,
Mean = = 38.13 ≈ 38.1
Hence, mean = 38.1
(ii) By formula,
Mean =
If mean = 39.
No. of matches to add = 3900 - 3813 = 87.
Hence, 87 extra matches need to be added.
If the mean of the following distribution is 3, find the value of p.
| x | f |
|---|---|
| 1 | 9 |
| 2 | 6 |
| 3 | 9 |
| 5 | 3 |
| p + 4 | 6 |
Answer
| x | f | fx |
|---|---|---|
| 1 | 9 | 9 |
| 2 | 6 | 12 |
| 3 | 9 | 27 |
| 5 | 3 | 15 |
| p + 4 | 6 | 6p + 24 |
| Total | Σf = 33 | Σfx = 6p + 87 |
By formula,
Mean =
Substituting values we get,
⇒ 3 =
⇒ 99 = 6p + 87
⇒ 12 = 6p
⇒ p =
⇒ p = 2.
Hence, p = 2.
In the following table, Σf = 200 and mean = 73. Find the missing frequencies f1 and f2.
| x | f |
|---|---|
| 0 | 46 |
| 50 | f1 |
| 100 | f2 |
| 150 | 25 |
| 200 | 10 |
| 250 | 5 |
Answer
| x | f | fx |
|---|---|---|
| 0 | 46 | 0 |
| 50 | f1 | 50f1 |
| 100 | f2 | 100f2 |
| 150 | 25 | 3750 |
| 200 | 10 | 2000 |
| 250 | 5 | 1250 |
| Total | 86 + f1 + f2 | 7000 + 50f1 + 100f2 |
Given,
⇒ Σf = 200
⇒ 86 + f1 + f2 = 200
⇒ f1 + f2 = 200 - 86
⇒ f1 + f2 = 114
⇒ f1 = 114 - f2 ........(1)
Given, mean = 73
Substituting value of f2 in (1), we get :
⇒ f1 = 114 - f2 = 114 - 38 = 76.
Hence, f1 = 76 and f2 = 38.
Find the arithmetic mean (correct to nearest whole number) by using step deviation method.
| x | f |
|---|---|
| 5 | 20 |
| 10 | 43 |
| 15 | 75 |
| 20 | 67 |
| 25 | 72 |
| 30 | 45 |
| 35 | 39 |
| 40 | 9 |
| 45 | 8 |
| 50 | 6 |
Answer
Let assumed mean (A) be 25.
| x | f | d = x - A | t = (x - A)/i | ft |
|---|---|---|---|---|
| 5 | 20 | -20 | -4 | -80 |
| 10 | 43 | -15 | -3 | -129 |
| 15 | 75 | -10 | -2 | -150 |
| 20 | 67 | -5 | -1 | -67 |
| A = 25 | 72 | 0 | 0 | 0 |
| 30 | 45 | 5 | 1 | 45 |
| 35 | 39 | 10 | 2 | 78 |
| 40 | 9 | 15 | 3 | 27 |
| 45 | 8 | 20 | 4 | 32 |
| 50 | 6 | 25 | 5 | 30 |
| Total | Σf = 384 | Σft = -214 |
By formula,
Mean = A +
= 25 -
= 25 - 2.786
= 22.21 ≈ 22.
Hence, mean = 22.
Find the mean (correct to one place of decimal) by using short-cut method.
| x | f |
|---|---|
| 40 | 14 |
| 41 | 28 |
| 43 | 38 |
| 45 | 50 |
| 46 | 40 |
| 49 | 20 |
| 50 | 10 |
Answer
Let the assumed mean (A) be 45
| x | f | d = x - A | fd |
|---|---|---|---|
| 40 | 14 | 40 - 45 = -5 | -70 |
| 41 | 28 | 41 - 45 = -4 | -112 |
| 43 | 38 | 43 - 45 = -2 | -76 |
| A = 45 | 50 | 45 - 45 = 0 | 0 |
| 46 | 40 | 46 - 45 = 1 | 40 |
| 49 | 20 | 49 - 45 = 4 | 80 |
| 50 | 10 | 50 - 45 = 5 | 50 |
| Total | Σf = 200 | Σfd = -88 |
By formula,
Mean = A +
= 45 - 0.44
= 44.56 ≈ 44.6
Hence, mean = 44.6
The mean of given observations is :
| C.I. | f |
|---|---|
| 30-40 | 2 |
| 40-50 | 3 |
41
27
71
91
Answer
| C.I. | f | Mean value (x) | fx |
|---|---|---|---|
| 30-40 | 2 | 35 | 70 |
| 40-50 | 3 | 45 | 135 |
| Total | Σf = 5 | Σfx = 205 |
By formula,
Mean = = 41.
Hence, Option 1 is the correct option.
For data given in the adjoining table, the mean is :
| C.I. | f | x |
|---|---|---|
| 0-10 | 5 | |
| 10-20 | 10 | |
| 20-30 | 10 |
17
27
25
60
Answer
In the table,
x is the mean value or class mark,
i = class-size = 10,
| C.I. | f | x | u = (x - A)/i | f × u |
|---|---|---|---|---|
| 0-10 | 5 | 5 | (5 - 15)/10 = -10/10 = -1 | -5 |
| 10-20 | 10 | A = 15 | (15 - 15)/10 = 0/10 = 0 | 0 |
| 20-30 | 10 | 25 | (25 - 15)/10 = 10/10 = 1 | 10 |
| Total | Σf = 25 | Σfu = 5 |
By formula,
Mean = A +
Substituting values we get :
Mean = 15 + = 15 + 2 = 17.
Hence, Option 1 is the correct option.
The mean of observations, given in the adjoining table, is 24, the value of a is :
| x | f |
|---|---|
| 10 | 10 |
| 20 | a |
| 30 | 30 |
20
30
10
25
Answer
| x | f | fx |
|---|---|---|
| 10 | 10 | 100 |
| 20 | a | 20a |
| 30 | 30 | 900 |
| Total | Σf = 40 + a | Σfx = 1000 + 20a |
By formula,
Mean =
Substituting values we get :
⇒ 24(40 + a) = 1000 + 20a
⇒ 960 + 24a = 1000 + 20a
⇒ 24a - 20a = 1000 - 960
⇒ 4a = 40
⇒ a = 10.
Hence, Option 3 is the correct option.
If the mean of the data given in adjoining table is 20, the relation between x1 and x2 is :
| x | f |
|---|---|
| 10 | x1 |
| 20 | 20 |
| 30 | x2 |
x1 + x2 = 30
x1 - x2 = 15
x1 - x2 = 0
x1 + x2 = 20
Answer
| x | f | fx |
|---|---|---|
| 10 | x1 | 10x1 |
| 20 | 20 | 400 |
| 30 | x2 | 30x2 |
| Total | Σf = 20 + x1 + x2 | Σfx = 400 + 10x1 + 30x2 |
By formula,
Mean =
Substituting values we get :
Hence, Option 3 is the correct option.
The mean of data, represented by given diagram is :
53
47
42
51

Answer
Table from the given graph is :
| C.I. | Class mark (x) | Frequency (f) | fx |
|---|---|---|---|
| 40-50 | 45 | 40 | 1800 |
| 50-60 | 55 | 10 | 550 |
| Total | Σf = 50 | Σfx = 2350 |
By formula,
Mean = = 47.
Hence, Option 2 is the correct option.
The following table gives the ages of 50 students of a class. Find the arithmetic mean of their ages.
| Age (years) | No. of students |
|---|---|
| 16 - 18 | 2 |
| 18 - 20 | 7 |
| 20 - 22 | 21 |
| 22 - 24 | 17 |
| 24 - 26 | 3 |
Answer
| Age (years) | Mid value (x) | No. of students (f) | fx |
|---|---|---|---|
| 16 - 18 | 17 | 2 | 34 |
| 18 - 20 | 19 | 7 | 133 |
| 20 - 22 | 21 | 21 | 441 |
| 22 - 24 | 23 | 17 | 391 |
| 24 - 26 | 25 | 3 | 75 |
| Total | Σf = 50 | Σfx = 1074 |
By formula,
Mean = = 21.48
Hence, mean = 21.48
The following are the marks obtained by 70 boys in a class test.
| Marks | No. of boys |
|---|---|
| 30 - 40 | 10 |
| 40 - 50 | 12 |
| 50 - 60 | 14 |
| 60 - 70 | 12 |
| 70 - 80 | 9 |
| 80 - 90 | 7 |
| 90 - 100 | 6 |
Calculate the mean by :
(i) Short-cut method
(ii) Step-deviation method
Answer
(i) Let assumed mean (A) be 65.
| Marks | Mid value (x) | No. of boys (f) | d = x - A | fd |
|---|---|---|---|---|
| 30 - 40 | 35 | 10 | 35 - 65 = -30 | -300 |
| 40 - 50 | 45 | 12 | 45 - 65 = -20 | -240 |
| 50 - 60 | 55 | 14 | 55 - 65 = -10 | -140 |
| 60 - 70 | 65 | 12 | 65 - 65 = 0 | 0 |
| 70 - 80 | 75 | 9 | 75 - 65 = 10 | 90 |
| 80 - 90 | 85 | 7 | 85 - 65 = 20 | 140 |
| 90 - 100 | 95 | 6 | 95 - 65 = 30 | 180 |
| Total | Σf = 70 | Σfx = -270 |
n = Σf = 70.
By formula,
Mean = A +
= 65 - 3.86 = 61.14
Hence, mean = 61.14
(ii) We get mean values from part (i) and assumed mean (A) = 65. Let i = 10.
| Marks | Mid value (x) | No. of boys (f) | d = x - A | t = (x - A)/i | ft |
|---|---|---|---|---|---|
| 30 - 40 | 35 | 10 | 35 - 65 = -30 | -3 | -30 |
| 40 - 50 | 45 | 12 | 45 - 65 = -20 | -2 | -24 |
| 50 - 60 | 55 | 14 | 55 - 65 = -10 | -1 | -14 |
| 60 - 70 | 65 | 12 | 65 - 65 = 0 | 0 | 0 |
| 70 - 80 | 75 | 9 | 75 - 65 = 10 | 1 | 9 |
| 80 - 90 | 85 | 7 | 85 - 65 = 20 | 2 | 14 |
| 90 - 100 | 95 | 6 | 95 - 65 = 30 | 3 | 18 |
| Total | Σf = 70 | Σft = -27 |
n = Σf = 70.
By formula,
Mean = A +
= 65 +
= 65 -
= 65 - 3.86
= 61.14
Hence, mean = 61.14
Find mean by 'step-deviation method' :
| C.I. | Frequency |
|---|---|
| 63 - 70 | 9 |
| 70 - 77 | 13 |
| 77 - 84 | 27 |
| 84 - 91 | 38 |
| 91 - 98 | 32 |
| 98 - 105 | 16 |
| 105 - 112 | 15 |
Answer
Let assumed mean (A) be 87.5 and i = 7.
| C.I. | Class mark (x) | Frequency (f) | d = x - A | t = (x - a)/i | ft |
|---|---|---|---|---|---|
| 63 - 70 | 66.5 | 9 | 66.5 - 87.5 = -21 | -3 | -27 |
| 70 - 77 | 73.5 | 13 | 73.5 - 87.5 = -14 | -2 | -26 |
| 77 - 84 | 80.5 | 27 | 80.5 - 87.5 = -7 | -1 | -27 |
| 84 - 91 | 87.5 | 38 | 87.5 - 87.5 = 0 | 0 | 0 |
| 91 - 98 | 94.5 | 32 | 94.5 - 87.5 = 7 | 1 | 32 |
| 98 - 105 | 101.5 | 16 | 101.5 - 87.5 = 14 | 2 | 32 |
| 105 - 112 | 108.5 | 15 | 108.5 - 87.5 = 21 | 3 | 45 |
| Total | Σf = 160 | Σft = 29 |
n = Σf = 160.
By formula,
Mean = A +
= 87.5 +
= 87.5 +
= 87.5 + 1.3
= 88.8
Hence, mean = 88.8
The mean of following frequency distribution is . Find the value of 'f'.
| Class interval | Frequency |
|---|---|
| 0 - 10 | 8 |
| 10 - 20 | 22 |
| 20 - 30 | 31 |
| 30 - 40 | f |
| 40 - 50 | 2 |
Answer
| Class interval | Class mark (x) | Frequency (f) | fx |
|---|---|---|---|
| 0 - 10 | 5 | 8 | 40 |
| 10 - 20 | 15 | 22 | 330 |
| 20 - 30 | 25 | 31 | 775 |
| 30 - 40 | 35 | f | 35f |
| 40 - 50 | 45 | 2 | 90 |
| Total | Σf = 63 + f | Σfx = 1235 + 35f |
By formula,
Mean =
Hence, f = 7.
Using the information given in the adjoining histogram; calculate the mean.

Answer
The table for the adjoining histogram is :
| Class interval | Class mean (x) | Frequency (f) | fx |
|---|---|---|---|
| 15 - 25 | 20 | 10 | 200 |
| 25 - 35 | 30 | 20 | 600 |
| 35 - 45 | 40 | 25 | 1000 |
| 45 - 55 | 50 | 15 | 750 |
| 55 - 65 | 60 | 5 | 300 |
| Total | Σf = 75 | Σfx = 2850 |
By formula,
Mean = = 38.
Hence, mean = 38.
If the mean of the following observations is 54, find the value of p.
| Class | Frequency |
|---|---|
| 0 - 20 | 7 |
| 20 - 40 | p |
| 40 - 60 | 10 |
| 60 - 80 | 9 |
| 80 - 100 | 13 |
Answer
By formula,
Class mark =
| Class | Class mark (x) | Frequency (f) | fx |
|---|---|---|---|
| 0 - 20 | 10 | 7 | 70 |
| 20 - 40 | 30 | p | 30p |
| 40 - 60 | 50 | 10 | 500 |
| 60 - 80 | 70 | 9 | 630 |
| 80 - 100 | 90 | 13 | 1170 |
| Total | Σf = 39 + p | 2370 + 30p |
By formula,
Mean =
⇒ 54 =
⇒ 54(39 + p) = 2370 + 30p
⇒ 2106 + 54p = 2370 + 30p
⇒ 54p - 30p = 2370 - 2106
⇒ 24p = 264
⇒ p =
⇒ p = 11.
Hence, p = 11.
The mean of the following distribution is 62.8 and the sum of all the frequencies is 50. Find the missing frequencies f1 and f2.
| Class | Frequency |
|---|---|
| 0 - 20 | 5 |
| 20 - 40 | f1 |
| 40 - 60 | 10 |
| 60 - 80 | f2 |
| 80 - 100 | 7 |
| 100 - 120 | 8 |
Answer
By formula,
Class mark =
| Class | Class mark (x) | Frequency (f) | fx |
|---|---|---|---|
| 0 - 20 | 10 | 5 | 50 |
| 20 - 40 | 30 | f1 | 30 f1 |
| 40 - 60 | 50 | 10 | 500 |
| 60 - 80 | 70 | f2 | 70f2 |
| 80 - 100 | 90 | 7 | 630 |
| 100 - 120 | 110 | 8 | 880 |
| Total | Σf = f1 + f2 + 30 | 2060 + 30f1 + 70f2 |
Given,
Sum of frequencies = 50
⇒ f1 + f2 + 30 = 50
⇒ f1 + f2 = 20
⇒ f1 = 20 - f2 ........(1)
By formula,
Mean =
⇒ 62.8 =
⇒ 2060 + 30f1 + 70f2 = 3140
⇒ 30f1 + 70f2 = 1080
Substituting value of f1 in above equation from (1), we get :
⇒ 30(20 - f2) + 70f2 = 1080
⇒ 600 - 30f2 + 70f2 = 1080
⇒ 40f2 = 480
⇒ f2 = = 12.
⇒ f1 = 20 - f2 = 20 - 12 = 8.
Hence, f1 = 8 and f2 = 12.
Calculate the mean of the distribution, given below, using the short cut method :
| Marks | No. of students |
|---|---|
| 11 - 20 | 2 |
| 21 - 30 | 6 |
| 31 - 40 | 10 |
| 41 - 50 | 12 |
| 51 - 60 | 9 |
| 61 - 70 | 7 |
| 71 - 80 | 4 |
Answer
The above distribution is discontinuous, converting into continuous distribution, we get :
Adjustment factor = (Lower limit of one class - Upper limit of previous class) / 2
=
= 0.5
Subtract the adjustment factor (0.5) from all the lower limits and add the adjustment factor (0.5) to all the upper limits.
Let assumed mean (A) be 45.5
| Marks (Classes before adjustment) | Marks (Classes after adjustment) | Class mean (x) | d = x - A | No. of students (frequency) | fd |
|---|---|---|---|---|---|
| 11 - 20 | 10.5 - 20.5 | 15.5 | -30 | 2 | -60 |
| 21 - 30 | 20.5 - 30.5 | 25.5 | -20 | 6 | -120 |
| 31 - 40 | 30.5 - 40.5 | 35.5 | -10 | 10 | -100 |
| 41 - 50 | 40.5 - 50.5 | 45.5 | 0 | 12 | 0 |
| 51 - 60 | 50.5 - 60.5 | 55.5 | 10 | 9 | 90 |
| 61 - 70 | 60.5 - 70.5 | 65.5 | 20 | 7 | 140 |
| 71 - 80 | 70.5 - 80.5 | 75.5 | 30 | 4 | 120 |
| Total | 50 | 70 |
n = Σf = 50
Mean = A +
=
= 45.5 + 1.4
= 46.9
Hence, mean = 46.9
The median of 18, 29, 15, 14 and 21 is :
15
18
29
21
Answer
Arranging the numbers in ascending order, we get :
14, 15, 18, 21, 29.
The number of terms (n) are 5, which is odd.
∴ Median = th term
Substituting value we get :
Median = = 3rd term = 18.
Hence, Option 2 is the correct option.
The median of 3, 8, 11, 2, 16, 4, 0 and 6 is :
6
9
5
8
Answer
Arranging the numbers in ascending order, we get :
0, 2, 3, 4, 6, 8, 11, 16.
The number of terms (n) are 8, which is even.
∴ Median =
Substituting values we get :
Hence, Option 3 is the correct option.
Numbers 5, 15, 20, x, 28, 30, 35 are in ascending order and have median = 23; then the value of x is :
24
29
17.5
23
Answer
Given, numbers :
5, 15, 20, x, 28, 30, 35
The number of terms (n) are 7, which is odd.
∴ Median = th term
Substituting value we get :
Hence, Option 4 is the correct option.
For numbers 10, 20, 30, 40, 50, 60, 70 and 80; the inter-quartile range is :
20 + 60
60 - 30
60 - 20
50 - 10
Answer
Numbers in ascending order : 10, 20, 30, 40, 50, 60, 70 and 80.
The number of terms (n) are 8, which is even.
∴ Lower quartile = = 2nd term = 20.
∴ Upper quartile = = 6th term = 60.
Inter-quartile = Upper quartile - Lower quartile = 60 - 20.
Hence, Option 3 is the correct option.
From the given diagram, the modal class is :
30 - 40
40 - 50
50 - 60
60 - 70

Answer
From figure,
Class 50-60 has the highest frequency.
Hence, Option 3 is the correct option.
A student got the following marks in 9 questions of a question paper.
3, 5, 7, 3, 8, 0, 1, 4 and 6. Find the median of these marks.
Answer
Arranging the given data in ascending order :
0, 1, 3, 3, 4, 5, 6, 7, 8
Here, n = 9. Since, n is odd.
By formula,
Median = th term.
Substituting values we get,
Median = = 5th term.
Here, 5th term = 4.
Hence, median = 4.
The weights (in kg) of 10 students of a class are given below :
21, 28.5, 20.5, 24, 25.5, 22, 27.5, 28, 21 and 24. Find the median of their weights.
Answer
Arranging the given data in ascending order:
20.5, 21, 21, 22, 24, 24, 25.5, 27.5, 28, 28.5
Here, n = 10, which is even.
By formula,
Median =
Hence, median = 24.
The marks obtained by 19 students of a class are given below :
27, 36, 22, 31, 25, 26, 33, 24, 37, 32, 29, 28, 36, 35, 27, 26, 32, 35 and 28. Find:
(i) Median
(ii) lower quartile
(iii) Upper quartile
(iv) Inter-quartile range
Answer
Arranging in ascending order:
22, 24, 25, 26, 26, 27, 27, 28, 28, 29, 21, 32, 32, 33, 35, 35, 36, 36, 37
(i) Here, n = 19, which is odd.
By formula,
Median = th term.
= = 10th term
= 29.
Hence, median = 29.
(ii) Since, n = 19, which is odd.
By formula,
Lower quartile =
= 5th term = 26.
Hence, lower quartile = 26.
(iii) Since, n = 19, which is odd.
By formula,
Upper quartile =
= 15th term = 35.
Hence, upper quartile = 35.
(iv) Inter quartile range = Upper quartile - Lower quartile
= 35 - 26
= 9.
Hence, inter quartile range = 9.
The weight of 60 boys are given in the following distribution table :
| Weight (kg) | No. of boys |
|---|---|
| 37 | 10 |
| 38 | 14 |
| 39 | 18 |
| 40 | 12 |
| 41 | 6 |
Find :
(i) Median
(ii) Lower quartile
(iii) Upper quartile
(iv) Inter quartile range.
Answer
Cumulative frequency distribution table :
| Weight (kg) | No. of boys (f) | Cumulative frequency |
|---|---|---|
| 37 | 10 | 10 |
| 38 | 14 | 24 (10 + 14) |
| 39 | 18 | 42 (24 + 18) |
| 40 | 12 | 54 (42 + 12) |
| 41 | 6 | 60 (6 + 54) |
(i) Here, n = 60, which is even.
By formula,
Median =
Substituting values we get :
Median =
From table,
The weight of each boy from 25th to 42nd is 39 kg.
∴ 30th term and 31st term = 39
Substituting value to get median :
Median = = 39 kg.
(ii) Here, n = 60, which is even.
By formula,
Lower quartile = th term
= = 15th term.
From table,
The weight of each boy from 11th to 24th term is 38 kg.
Hence, lower quartile = 38.
(iii) Here, n = 60, which is even.
By formula,
Upper quartile = th term
= = 45th term.
From table,
The weight of each boy from 43rd to 54th is 40 kg.
Hence, upper quartile = 40.
(iv) Inter quartile range = Upper quartile - Lower quartile
= 40 - 38
= 2.
Hence, inter-quartile range = 2.
From the following cumulative frequency table draw ogive and then use it to find :
(i) Median
(ii) Lower quartile
(iii) Upper quartile
| Marks (less than) | Cumulative frequency |
|---|---|
| 10 | 5 |
| 20 | 24 |
| 30 | 37 |
| 40 | 40 |
| 50 | 42 |
| 60 | 48 |
| 70 | 70 |
| 80 | 77 |
| 90 | 79 |
| 100 | 80 |
Answer
Cumulative frequency distribution table :
| Marks | Cumulative frequency |
|---|---|
| 0 - 10 | 5 |
| 10 - 20 | 24 |
| 20 - 30 | 37 |
| 30 - 40 | 40 |
| 40 - 50 | 42 |
| 50 - 60 | 48 |
| 60 - 70 | 70 |
| 70 - 80 | 77 |
| 80 - 90 | 79 |
| 90 - 100 | 80 |
Here, n = 80, which is even.
By formula,
Median = th term
= = 40th term.
Lower quartile = th term
= = 20th term.
Upper quartile = th term
= = 60th term.
Steps of construction of ogive :
Take 1 cm = 10 units on x-axis.
Take 1 cm = 10 units on y-axis.
Plot the point (0, 0), as ogive always starts on x-axis representing the lower limit of the first class.
Plot the points (10, 5), (20, 24), (30, 37), (40, 40), (50, 42), (60, 48), (70, 70), (80, 77), (90, 79) and (100, 80).
Join the points by a free hand curve.
Draw a line parallel to x-axis from point L (frequency) = 40, touching the graph at point T. From point T draw a line parallel to y-axis touching x-axis at point M.
Draw a line parallel to x-axis from point N (frequency) = 20, touching the graph at point O. From point O draw a line parallel to y-axis touching x-axis at point P.
Draw a line parallel to x-axis from point Q (frequency) = 60, touching the graph at point R. From point R draw a line parallel to y-axis touching x-axis at point S.
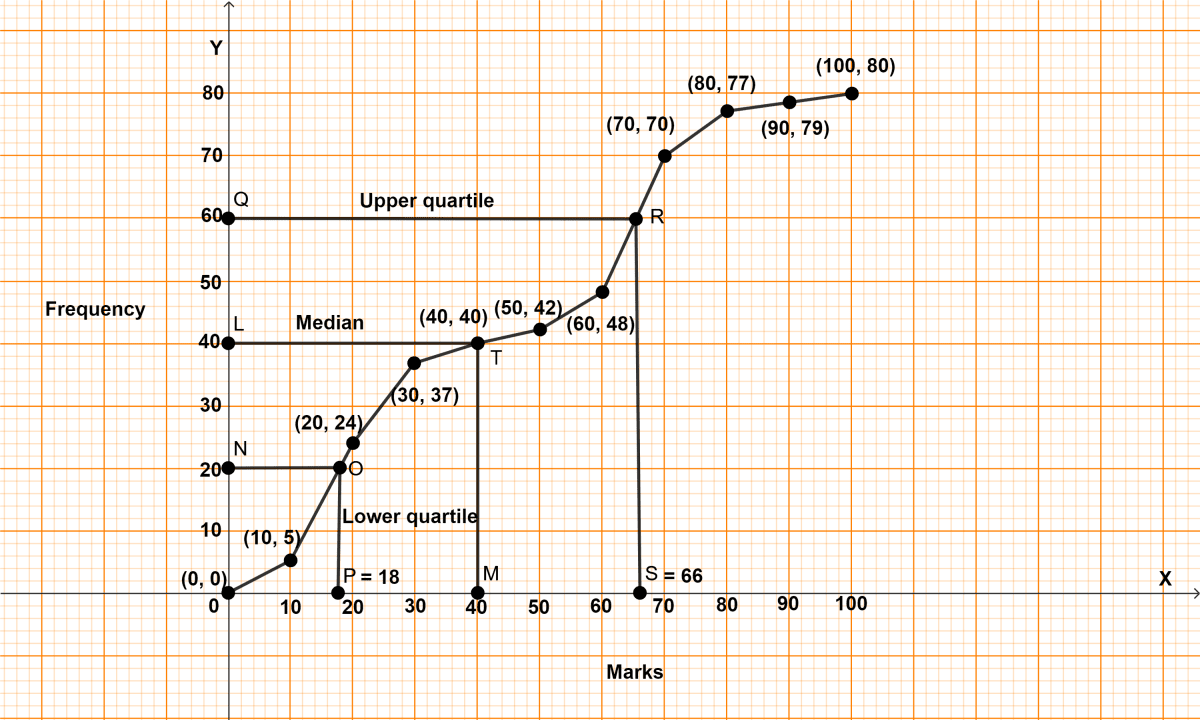
(i) From graph, M = 40
Hence, median = 40.
(ii) From graph, P = 18
Hence, lower quartile = 18.
(iii) From graph, S = 66
Hence, upper quartile = 66.
In a school, 100 pupils have heights as tabulated below :
| Height (in cm) | No. of pupils |
|---|---|
| 121 - 130 | 12 |
| 131 - 140 | 16 |
| 141 - 150 | 30 |
| 151 - 160 | 20 |
| 161 - 170 | 14 |
| 171 - 180 | 8 |
Find the median height by drawing an ogive.
Answer
The above distribution is discontinuous, converting into continuous distribution, we get :
Adjustment factor = (Lower limit of one class - Upper limit of previous class) / 2
=
= 0.5
Subtract the adjustment factor (0.5) from all the lower limits and add the adjustment factor (0.5) to all the upper limits.
| Classes before adjustment | Classes after adjustment | No. of pupils | Cumulative frequency |
|---|---|---|---|
| 121 - 130 | 120.5 - 130.5 | 12 | 12 |
| 131 - 140 | 130.5 - 140.5 | 16 | 28 (12 + 16) |
| 141 - 150 | 140.5 - 150.5 | 30 | 58 (28 + 30) |
| 151 - 160 | 150.5 - 160.5 | 20 | 78 (58 + 20) |
| 161 - 170 | 160.5 - 170.5 | 14 | 92 (78 + 14) |
| 171 - 180 | 170.5 - 180.5 | 8 | 100 (92 + 8) |
Here, n = 100 which is even.
By formula,
Median = = 50th term.
Steps of construction of ogive :
Since, the scale on x-axis starts at 120.5, a break (kink) is shown near the origin on x-axis to indicate that the graph is drawn to scale beginning at 120.5.
Take 2 cm along x-axis = 10 units.
Take 1 cm along y-axis = 10 units.
Plot the point (120.5, 0), as ogive always starts on x-axis representing the lower limit of the first class.
Plot the points (130.5, 12), (140.5, 28), (150.5, 58), (160.5, 78), (170.5, 92) and (180.5, 100).
Join the points by a free hand curve.
Draw a line parallel to x-axis from point A (frequency) = 50, touching the graph at point B. From point B draw a line parallel to y-axis touching x-axis at point C.
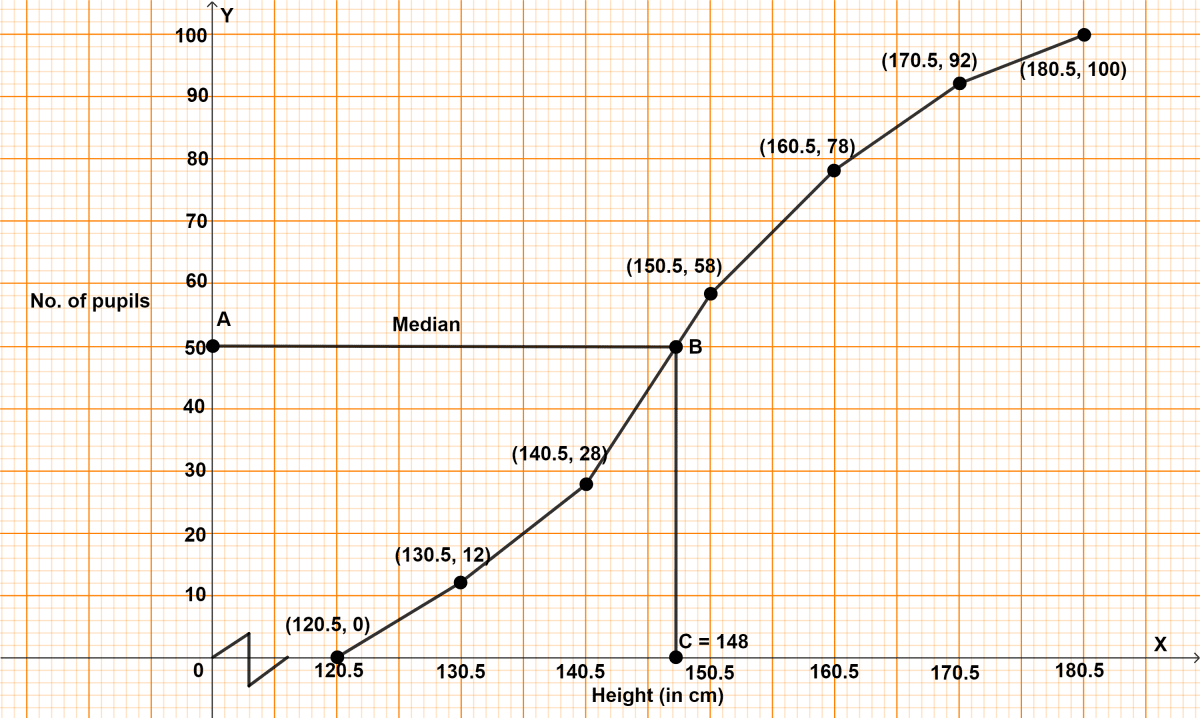
From graph, C = 148 cm
Hence, median = 148 cm.
Find the mode of following data, using a histogram :
| Class | Frequency |
|---|---|
| 0 - 10 | 5 |
| 10 - 20 | 12 |
| 20 - 30 | 20 |
| 30 - 40 | 9 |
| 40 - 50 | 4 |
Answer
Steps :
Draw a histogram of the given distribution.
Inside the highest rectangle, which represents the maximum frequency (or modal class), draw two lines AC and BD diagonally from the upper corners C and D of adjacent rectangles.
Through point K (the point of intersection of diagonals AC and BD), draw KL perpendicular to the horizontal axis.
The value of point L on the horizontal axis represents the value of mode.
∴ Mode = 24.

Hence, mode = 24.
The following table shows the expenditure of 60 boys on books. Find the mode of their expenditure.
| Expenditure (₹) | No. of students |
|---|---|
| 20 - 25 | 4 |
| 25 - 30 | 7 |
| 30 - 35 | 23 |
| 35 - 40 | 18 |
| 40 - 45 | 6 |
| 45 - 50 | 2 |
Answer
Steps :
Draw a histogram of the given distribution.
Inside the highest rectangle, which represents the maximum frequency (or modal class), draw two lines MJ and LO diagonally from the upper corners M and L of adjacent rectangles.
Through point Z (the point of intersection of diagonals MJ and LO), draw ZP perpendicular to the horizontal axis.
The value of point P on the horizontal axis represents the value of mode.
∴ Mode = 34.

Hence, mode = 34.
A boy scored the following marks in various class tests during a term, each test being marked out of 20.
15, 17, 16, 7, 10, 12, 14, 16, 19, 12 and 16.
(i) What are his modal marks ?
(ii) What are his median marks ?
(iii) What are his total marks ?
(iv) What are his mean marks ?
Answer
(i) From above data,
16 occurs for the maximum time.
Hence, mode = 16.
(ii) Arranging the numbers in ascending order :
7, 10, 12, 12, 14, 15, 16, 16, 16, 17, 19.
Here, n = 11, which is odd.
By formula,
Median = th term
=
= 6th term
= 15.
Hence, median = 15.
(iii) Total marks = 7 + 10 + 12 + 12 + 14 + 15 + 16 + 16 + 16 + 17 + 19
= 154.
Hence, total marks = 154.
(iv) Mean =
=
= 14.
Hence, mean = 14.
At a shooting competition the scores of a competitor were as given below :
| Score | No. of shots |
|---|---|
| 0 | 0 |
| 1 | 3 |
| 2 | 6 |
| 3 | 4 |
| 4 | 7 |
| 5 | 5 |
(i) What was his modal score ?
(ii) What was his median score ?
(iii) What was his total score ?
(iv) What was his mean score ?
Answer
(i) From above table,
The score 4 has the maximum frequency.
Hence, modal score = 4.
(ii) Cumulative frequency distribution table :
| Score (x) | No. of shots (f) | Cumulative frequency | fx |
|---|---|---|---|
| 0 | 0 | 0 | 0 |
| 1 | 3 | 3 (0 + 3) | 3 |
| 2 | 6 | 9 (3 + 6) | 12 |
| 3 | 4 | 13 (9 + 4) | 12 |
| 4 | 7 | 20 (13 + 7) | 28 |
| 5 | 5 | 25 (20 + 5) | 25 |
| Total | 25 | 80 |
Here, n = 25, which is odd.
By formula,
Median = th term = = 13th term
From table, score of 10th to 13th term is 3.
Hence, median = 3.
(iii) From cumulative frequency distribution table we get,
Total score = 80.
Hence, total score = 80.
(iv) By formula,
Mean = = 3.2
Hence, mean = 3.2
The mean of numbers in A.P. 2, 4, 6, 8, ......, 40 is :
(2 + 40)
840
Answer
Given,
A.P. = 2, 4, 6, 8, ……, 40
First term (a) = 2
Common difference (d) = 4 - 2 = 2
Last term (l) = 40
Let no. of terms in A.P. be n.
⇒ 40 = a + (n - 1)d
⇒ 40 = 2 + 2(n - 1)
⇒ 40 = 2 + 2n - 2
⇒ 2n = 40
⇒ n = = 20.
By formula,
Sum of first n terms of an A.P. = .
Mean = = 21.
Solving,
= 21.
Hence, option 1 is the correct option.
The median of 10, 12, 9, 8, 12, 13, 8, 15 and 12 is :
12
13
Answer
Numbers in ascending order :
8, 8, 9, 10, 12, 12, 12, 13, 15.
Number of terms (n) = 9
∴ Median = = 5th term = 12.
Hence, Option 1 is the correct option.
The numbers 10, 12, 14, 16, 17 and x are in ascending order. If the mean and median of these observations are same, the value of x is :
16
14
54
21
Answer
Numbers in ascending order :
10, 12, 14, 16, 17 and x.
Mean =
Substituting values we get :
No. of terms (n) = 6, which is even.
Median =
Substituting values we get :
Given,
Mean = Median
Hence, Option 4 is the correct option.
The median of first six prime numbers is :
5
7
6
7.5
Answer
Prime numbers : 2, 3, 5, 7, 11, 13.
No. of terms (n) = 6, which is even.
Median =
Substituting values we get :
Hence, Option 3 is the correct option.
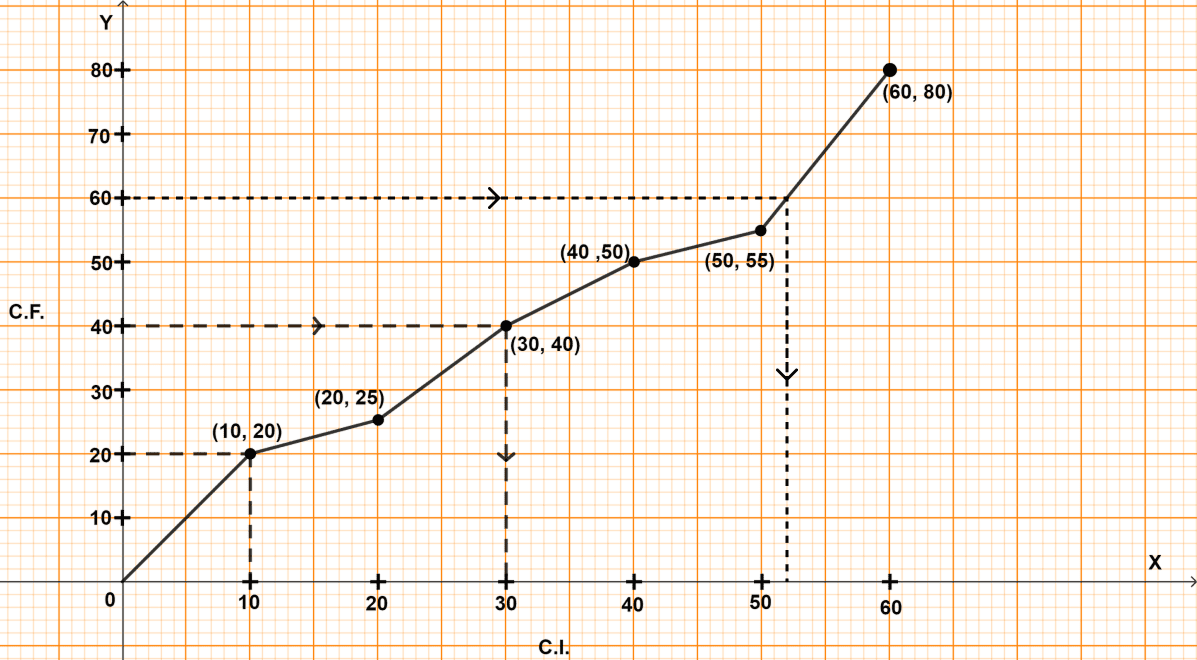
The inter quartile range for the given ogive is :
42
32
44
54
Answer
No. of terms (N) = 80
Lower quartile (Q1) = th term
= = 20 th term = 10.
Upper quartile (Q3) = th term
= = 60 th term.

From point A = 60. Draw a line parallel to x-axis touching the graph at B.
From point B, draw a line parallel to y-axis touching graph at C.
From graph, point C = 52.
∴ Upper quartile (Q3) = 52
By formula,
Inter quartile range = Upper quartile - Lower quartile
= Q3 - Q1
= 52 - 10 = 42.
Hence, Option 1 is the correct option.
The mean age of nine boys is 28 years and if one new boy joins them the mean age increases by one.
Assertion(A): The age of new boy is (29 x 10 - 28 x 9) years.
Reason(R): The age of new boy is (29 - 28) x 10 years.
A is true, R is false.
A is false, R is true.
Both A and R are true and R is correct reason for A.
Both A and R are true and R is incorrect reason for A.
Answer
Given, the mean age of 9 boys is 28 years.
when one new boy joins, the mean age increases by 1 year, making the new mean 29 years
By formula,
Mean =
The mean age of 9 boys is 28 years.
After the new boy joins, the mean age becomes 29 years for 10 boys.
The age of the new boy is the difference between the total age of 10 boys and the total age of 9 boys = 29 x 10 - 28 x 9
∴ A is true, R is false.
Hence, option 1 is the correct option.
Data = 37, 41, 56, 62, 70, 74, 81, 89, 95 and 90.
Assertion(A): Median = 72.
Reason(R): If number of data(n) is odd, the median = term.
A is true, R is false.
A is false, R is true.
Both A and R are true and R is correct reason for A.
Both A and R are true and R is incorrect reason for A.
Answer
Given, data = 37, 41, 56, 62, 70, 74, 81, 89, 95 and 90.
Arrange the data in ascending order: 37, 41, 56, 62, 70, 74, 81, 89, 90, 95
Number of data = 10
If the number of data points (n) is odd, the median is the term
If the number of data points (n) is even, the median is the
Here, n = 10
∴ Both A and R are true and R is incorrect reason for A.
Hence, option 4 is the correct option.
| C.I. | 0 - 10 | 10 - 20 | 20 - 30 |
|---|---|---|---|
| Frequency | 15 | 25 | b |
| Cumulative frequency | 15 | a | 50 |
Assertion(A): a = 15 + 25 = 40
b = 50 - a
Reason(R): a + 15 = 25
and b = 50 - 10
A is true, R is false.
A is false, R is true.
Both A and R are true and R is correct reason for A.
Both A and R are true and R is incorrect reason for A.
Answer
Cumulative frequency represents the running total of frequencies up to a certain class interval. For instance, the cumulative frequency for the class interval 10–20 includes all frequencies from the previous intervals as well. Therefore, the cumulative frequency for the 10–20 interval is the sum of the frequencies for the 0–10 and 10–20 intervals.
The cumulative frequency for the 10–20 interval is the sum of the frequencies for the 0–10 and 10–20 intervals:
a = 15 + 25 = 40
The cumulative frequency for the 20–30 interval is 50, which includes all previous frequencies. Therefore, the frequency for the 20–30 interval is:
b = 50 - a = 50 - 40 = 10.
∴ A is true, R is false.
Hence, option 1 is the correct option.
Data : 9, 11, 15, 19, 17, 13 and 7
Statement (1): For the given data, lower quantile is 11.
Statement (2): For data with n terms, the lower quantile is term, if n is odd.
Both the statements are true.
Both the statements are false.
Statement 1 is true, and statement 2 is false.
Statement 1 is false, and statement 2 is true.
Answer
Given data : 9, 11, 15, 19, 17, 13 and 7
Arrange the data in ascending order : 7, 9, 11, 13, 15, 17, 19.
For data with n terms, the lower quantile is term, if n is odd
Here, n = 7
∴ Statement 1 is false, and statement 2 is true.
Hence, option 4 is the correct option.
The mean of given data is 26.
| C.I. | 0 - 20 | 20 - 40 | 40 - 60 |
|---|---|---|---|
| f | 20 | x | 10 |
Statement (1): x = 26.
Statement (2): 26 = .
Both the statement are true.
Both the statement are false.
Statement 1 is true, and statement 2 is false.
Statement 1 is false, and statement 2 is true.
Answer
Given:
| C.I. | f | x(Midpoint) = (Lower limit + upper limit)/2 |
|---|---|---|
| 0-20 | 20 | 10 |
| 20-40 | x | 30 |
| 40-60 | 10 | 50 |
By formula; Mean =
Substituting the values, we get
∴ Statement 1 is false, and statement 2 is true.
Hence, option 4 is the correct option.
For a given set of data mean = 14 and median = 15.
Statement (1): Mode = 17.
Statement (2): Mode = 3 Median - 2 Mean s
Both the statements are true.
Both the statements are false.
Statement 1 is true, and statement 2 is false.
Statement 1 is false, and statement 2 is true.
Answer
Given, mean = 14 and median = 15
By formula,
Mode = 3 Median - 2 Mean
So, statement 2 is true.
Substituting the values, we get :
⇒ Mode = 3 x 15 - 2 x 14
⇒ Mode = 45 - 28
⇒ Mode = 17.
So, statement 1 is true.
∴ Both the statement are true.
Hence, option 1 is the correct option.
The mean of 1, 7, 5, 3, 4 and 4 is m. The numbers 3, 2, 4, 2, 3, 3 and p have mean m - 1 and median q. Find p and q.
Answer
Given,
Mean of 1, 7, 5, 3, 4 and 4 is m.
Sum of observations = 1 + 7 + 5 + 3 + 4 + 4 = 24.
Mean (m) = = 4.
Given,
Numbers 3, 2, 4, 2, 3, 3 and p have mean m - 1 or mean = 3.
Sum of observations = 3 + 2 + 4 + 2 + 3 + 3 + p = 17 + p.
Mean (m) =
⇒ 3 =
⇒ 21 = 17 + p
⇒ p = 4.
Observations in ascending order are = 2, 2, 3, 3, 3, 4, 4.
Here, n = 7, which is odd.
By formula,
Median = th term
= = 4th term = 3.
∴ q = 3.
Hence, p = 4 and q = 3.
In a malaria epidemic, the number of cases diagnosed were as follows :
| Date (July) | Number |
|---|---|
| 1 | 5 |
| 2 | 12 |
| 3 | 20 |
| 4 | 27 |
| 5 | 46 |
| 6 | 30 |
| 7 | 31 |
| 8 | 18 |
| 9 | 11 |
| 10 | 5 |
| 11 | 0 |
| 12 | 1 |
On what days do the mode, the upper and the lower quartiles occur ?
Answer
Cumulative frequency distribution table :
| Date (July) | Number (frequency) | Cumulative frequency |
|---|---|---|
| 1 | 5 | 5 |
| 2 | 12 | 17 (5 + 12) |
| 3 | 20 | 37 (17 + 20) |
| 4 | 27 | 64 (37 + 27) |
| 5 | 46 | 110 (64 + 46) |
| 6 | 30 | 140 (110 + 30) |
| 7 | 31 | 171 (140 + 31) |
| 8 | 18 | 189 (171 + 18) |
| 9 | 11 | 200 (189 + 11) |
| 10 | 5 | 205 (200 + 5) |
| 11 | 0 | 205 (205 + 0) |
| 12 | 1 | 206 (205 + 1) |
Here, n = 206, which is even
Lower quartile = th term
= = 51.5 th term
From table,
It is observed the date of 38th term to 64th term is 4th july.
Upper quartile = th term
= = 154.5 th term
From table,
It is observed the date of 141st term to 171st term is 7th july.
From table,
5th july has the highest no. of cases diagnosed.
Hence, mode = 5th july, upper quartile = 7th july and lower quartile = 4th july.
The marks obtained by 120 students in a Mathematics test are given below :
| Marks | No. of students |
|---|---|
| 0 - 10 | 5 |
| 10 - 20 | 9 |
| 20 - 30 | 16 |
| 30 - 40 | 22 |
| 40 - 50 | 26 |
| 50 - 60 | 18 |
| 60 - 70 | 11 |
| 70 - 80 | 6 |
| 80 - 90 | 4 |
| 90 - 100 | 3 |
Draw an ogive for the given distribution on a graph sheet. Use a suitable scale for your ogive. Use your ogive to estimate :
(i) the median
(ii) the number of students who obtained more than 75% marks in a test ?
(iii) the number of students who did not pass in the test if the pass percentage was 40?
(iv) the lower quartile.
Answer
Cumulative frequency distribution table :
| Marks | No. of students | Cumulative frequency |
|---|---|---|
| 0 - 10 | 5 | 5 |
| 10 - 20 | 9 | 14 (5 + 9) |
| 20 - 30 | 16 | 30 (14 + 16) |
| 30 - 40 | 22 | 52 (30 + 22) |
| 40 - 50 | 26 | 78 (52 + 26) |
| 50 - 60 | 18 | 96 (78 + 18) |
| 60 - 70 | 11 | 107 (96 + 11) |
| 70 - 80 | 6 | 113 (107 + 6) |
| 80 - 90 | 4 | 117 (113 + 4) |
| 90 - 100 | 3 | 120 (117 + 3) |
(i) Steps of construction of ogive :
Take 1 cm = 10 marks on x-axis.
Take 1 cm = 20 students on y-axis.
Plot the point (0, 0) as ogive starts from x-axis representing lower limit of first class.
Plot the points (10, 5), (20, 14), (30, 30), (40, 52), (50, 78), (60, 96), (70, 107), (80, 113), (90, 117) and (100, 120).
Join the points by a free hand curve.
Draw a line parallel to x-axis from point A (no. of students) = 60, touching the graph at point B. From point B draw a line parallel to y-axis touching x-axis at point C.
From graph, C = 43
Hence, median = 43.
(ii) Total marks = 100.
75% of 100 marks = = 75.
Draw a line parallel to y-axis from point D (marks) = 75, touching the graph at point E. From point E draw a line parallel to x-axis touching y-axis at point F.
From graph, F = 110.
It means that 110 students score either less or equal to 75% marks.
No. of students left = 120 - 110 = 10.
Hence, no. of students scoring more than 75% marks = 10.
(iii) Total marks = 100.
40% of 100 marks = = 40.
Draw a line parallel to y-axis from point G (marks) = 40, touching the graph at point H. From point H draw a line parallel to x-axis touching y-axis at point I.
From graph, I = 52.
Hence, no. of failed students = 52.
(iv) Here, n = 120, which is even.
By formula,
Lower quartile = = 30th term.
Draw a line parallel to x-axis from point J (no. of students) = 30, touching the graph at point K. From point K draw a line parallel to y-axis touching x-axis at point L.
From graph, L = 30
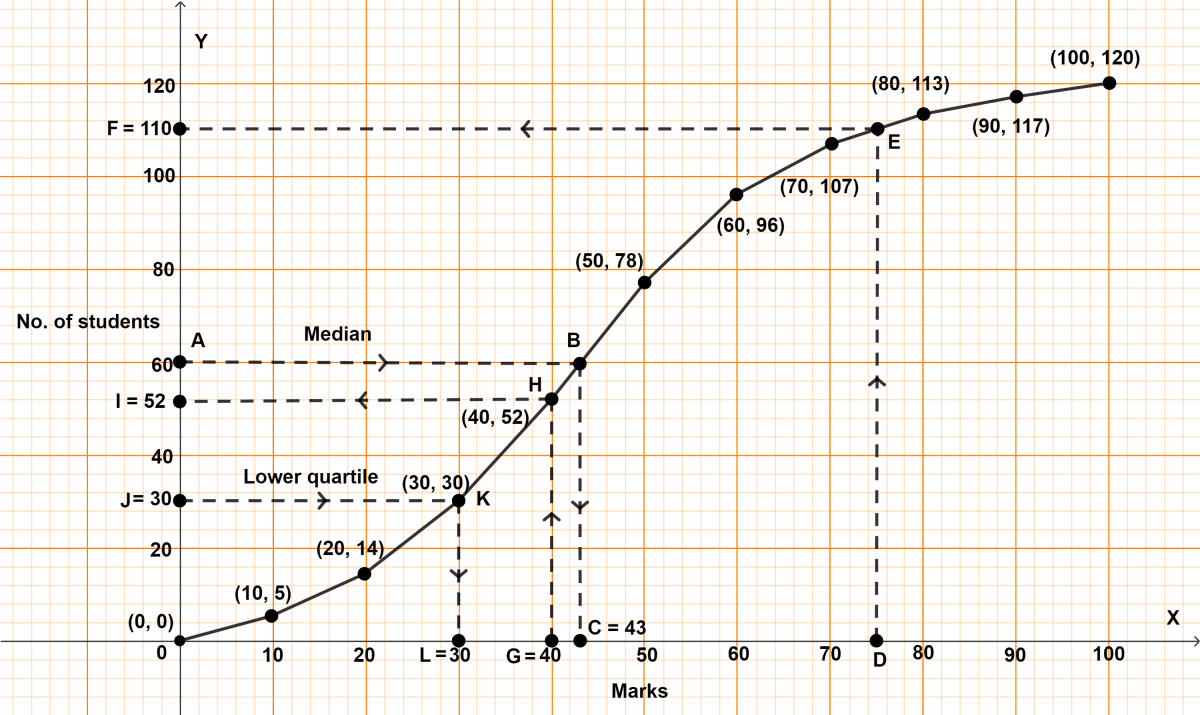
Hence, lower quartile = 30.
Using a graph paper, draw an ogive for the following distribution which shows a record of the weight in kilograms of 200 students.
| Weight | Frequency |
|---|---|
| 40 - 45 | 5 |
| 45 - 50 | 17 |
| 50 - 55 | 22 |
| 55 - 60 | 45 |
| 60 - 65 | 51 |
| 65 - 70 | 31 |
| 70 - 75 | 20 |
| 75 - 80 | 9 |
Use your ogive to estimate the following :
(i) The percentage of students weighing 55 kg or more.
(ii) The weight above which the heaviest 30% of the students fall,
(iii) The number of students who are (a) under-weight and (b) over weight, if 55.70 kg is considered as standard weight ?
Answer
(i) Cumulative frequency distribution table :
| Weight | Frequency | Cumulative frequency |
|---|---|---|
| 40 - 45 | 5 | 5 |
| 45 - 50 | 17 | 22 (5 + 17) |
| 50 - 55 | 22 | 44 (22 + 22) |
| 55 - 60 | 45 | 89 (44 + 45) |
| 60 - 65 | 51 | 140 (89 + 51) |
| 65 - 70 | 31 | 171 (140 + 31) |
| 70 - 75 | 20 | 191 (171 + 20) |
| 75 - 80 | 9 | 200 (191 + 9) |
Steps of construction :
Since, the scale on x-axis starts at 40, a break (kink) is shown near the origin on x-axis to indicate that the graph is drawn to scale beginning at 40.
Take 1 cm along x-axis = 5 kg.
Take 1 cm along y-axis = 20 units.
Plot the point (40, 0) as ogive starts from x-axis representing lower limit of first class.
Plot the points (45, 5), (50, 22), (55, 44), (60, 89), (65, 140), (70, 171), (75, 191) and (80, 200).
Join the points by a free hand curve.
Draw a line parallel to y-axis from point J (weight) = 55, touching the graph at point Q. From point Q draw a line parallel to x-axis touching y-axis at point K.
From graph, K = 44.
Hence, 44 students weight 55 kg or less.
Students weighing more than 55 kg = 200 - 44 = 156.
Percentage of students weighing more than 55 kg = = 78%.
Hence, percentage of students weighing more than 55 kg = 78%.
(ii) 30% of students = = 60.
Total students = 200
No. of Students not in heaviest 30% = 200 - 60 = 140.
Draw a line parallel to x-axis from point O (no. of students) = 140, touching the graph at point R. From point R draw a line parallel to y-axis touching x-axis at point P.
From graph, P = 65
Hence, above 65 kg the heaviest 30% of the students fall.
(iii) Draw a line parallel to y-axis from point L (weight) = 55.70 kg, touching the graph at point M. From point M draw a line parallel to x-axis touching y-axis at point N.
(a) From graph,
N = 46.
∴ 46 students have weight less than 55.70 kg
Hence, 46 students are underweight.
(b) Since, 46 students have weight less than 55.70 kg
∴ 154 (200 - 46) students have weight more than 55.70 kg
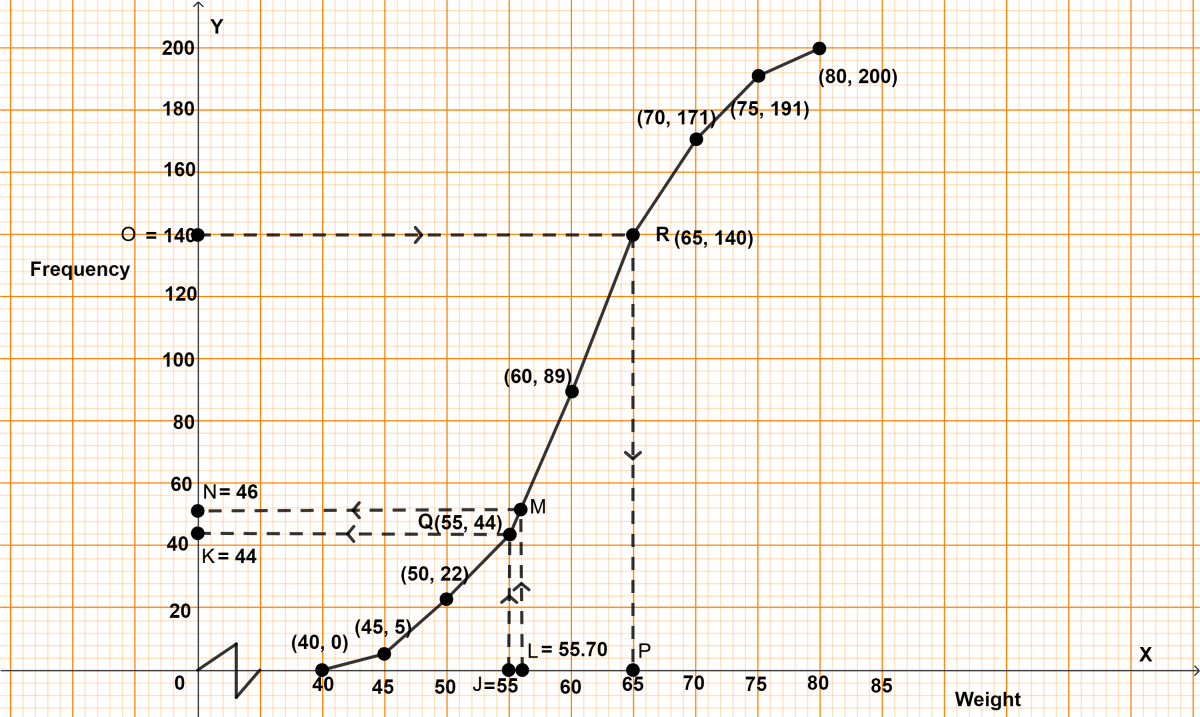
Hence, 154 students are overweight.
The distribution given below, shows the marks obtained by 25 students in an aptitude test. Find the mean, median and mode of the distribution.
| Marks obtained | No. of students |
|---|---|
| 5 | 3 |
| 6 | 9 |
| 7 | 6 |
| 8 | 4 |
| 9 | 2 |
| 10 | 1 |
Answer
Cumulative frequency distribution table :
| Marks obtained (x) | No. of students (f) | Cumulative frequency | fx |
|---|---|---|---|
| 5 | 3 | 3 | 15 |
| 6 | 9 | 12 | 54 |
| 7 | 6 | 18 | 42 |
| 8 | 4 | 22 | 32 |
| 9 | 2 | 24 | 18 |
| 10 | 1 | 25 | 10 |
| Total | Σf = 25 | Σfx = 171 |
By formula,
Mean = = 6.84
Here, n = 25, which is odd.
Median = th term
= = 13th term.
From table,
Marks obtained by 13th to 18th student = 7.
Median = 7.
From table,
6 marks has highest frequency.
Mode = 6.
Hence, mean = 6.84, median = 7 and mode = 6.
The monthly income of a group of 320 employees in a company is given below :
| Monthly income | No. of employees |
|---|---|
| 6 - 7 | 20 |
| 7 - 8 | 45 |
| 8 - 9 | 65 |
| 9 - 10 | 95 |
| 10 - 11 | 60 |
| 11 - 12 | 30 |
| 12 - 13 | 5 |
Draw an ogive of the given distribution on a graph sheet taking 2 cm = ₹ 1000 on one axis and 2 cm = 50 employees on the other axis. From the graph determine :
(i) the median wage.
(ii) the number of employees whose income is below ₹ 8500.
Answer
(i) Cumulative frequency distribution table :
| Monthly income | No. of employees | Cumulative frequency |
|---|---|---|
| 6 - 7 | 20 | 20 |
| 7 - 8 | 45 | 65 (20 + 45) |
| 8 - 9 | 65 | 130 (65 + 65) |
| 9 - 10 | 95 | 225 (130 + 95) |
| 10 - 11 | 60 | 285 (225 + 60) |
| 11 - 12 | 30 | 315 (285 + 30) |
| 12 - 13 | 5 | 320 (315 + 5) |
Here, n = 320, which is even.
By formula,
Median = th term
= = 160th term.
Steps of construction :
Since, the scale on x-axis starts at 6, a break (kink) is shown near the origin on x-axis to indicate that the graph is drawn to scale beginning at 6.
Take 2 cm along x-axis = 1 thousand rupees.
Take 1 cm along y-axis = 40 employees.
Plot the point (6, 0) as ogive starts from x-axis representing lower limit of first class.
Plot the points (7, 20), (8, 65), (9, 130), (10, 225), (11, 285), (12, 315) and (13, 320).
Join the points by a free hand curve.
Draw a line parallel to x-axis from point M (no. of employees) = 160, touching the graph at point N. From point N draw a line parallel to y-axis touching x-axis at point O.
From graph, O = 9.2 (thousands)
Hence, median wage = ₹ 9200.
(ii) Draw a line parallel to y-axis from point P (income) = ₹ 8.5 (thousands), touching the graph at point Q. From point Q draw a line parallel to x-axis touching y-axis at point R.
From graph, R = 95.
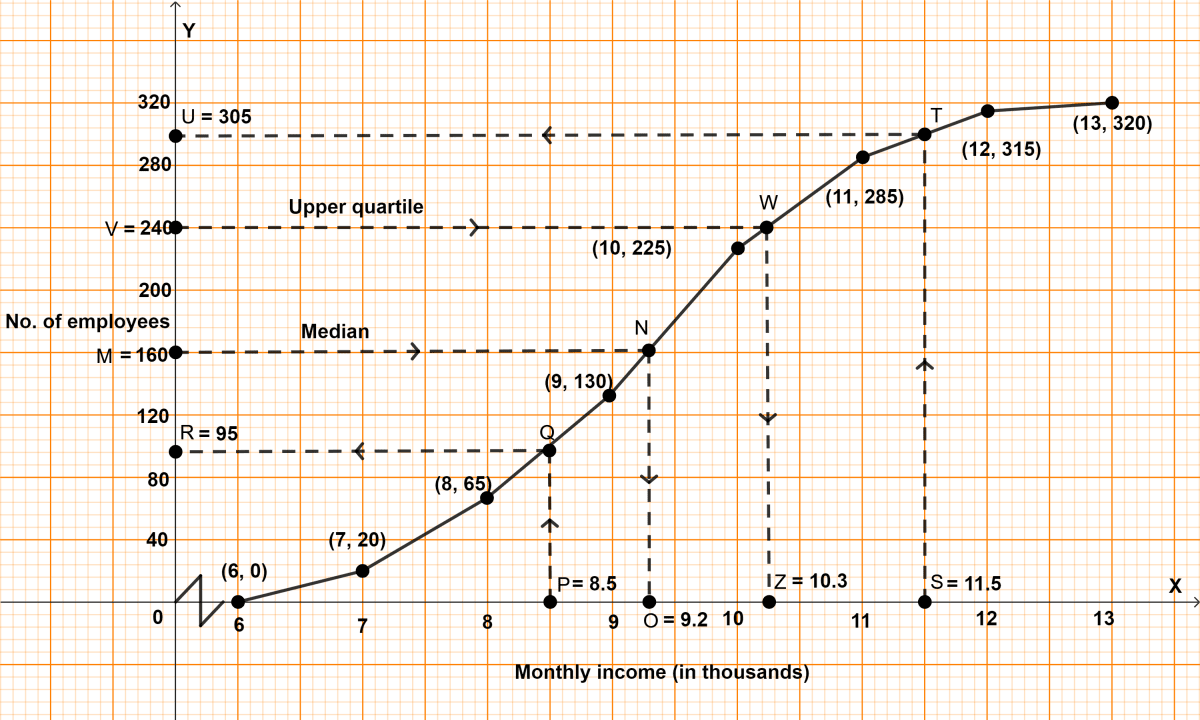
Hence, 95 employees have income less than ₹ 8500.
The mean of numbers 45, 52, 60, x, 69, 70, 26, 81 and 94 is 68. Find the value of x. Hence, estimate the median for the resulting data.
Answer
Sum of observations = 45 + 52 + 60 + x + 69 + 70 + 26 + 81 + 94 = 497 + x
No. of observations (n) = 9
Mean =
68 =
612 = 497 + x
x = 612 - 497 = 115.
Here, n = 9, which is odd.
Median = th term
=
= 5th term
= 69.
Hence, mean = 115 and median = 69.
The marks of 10 students of a class in an examination arranged in ascending order is as follows :
13, 35, 43, 46, x, x + 4, 55, 61, 71, 80.
If the median marks is 48, find the value of x. Hence, find the mode of the given data.
Answer
Here, n = 10, which is even.
By formula,
Given,
Median = 48
⇒ x + 2 = 48
⇒ x = 46.
Set of observations : 13, 35, 42, 46, 46, 50, 55, 61, 71, 80.
Here, 46 has the maximum frequency.
∴ Mode = 46.
Hence, x = 46 and mode = 46.
The histogram below represents the scores obtained by 25 students in a Mathematics mental test. Use the data to :
(i) Frame a frequency distribution table.
(ii) To calculate mean.
(iii) To determine the modal class.

Answer
(i) Frequency distribution table :
| Marks (Class) | No. of students (frequency) |
|---|---|
| 0 - 10 | 2 |
| 10 - 20 | 5 |
| 20 - 30 | 8 |
| 30 - 40 | 4 |
| 40 - 50 | 6 |
(ii) Mean
| Marks (Class) | No. of students (frequency) | Class mean (x) | fx |
|---|---|---|---|
| 0 - 10 | 2 | 5 | 10 |
| 10 - 20 | 5 | 15 | 75 |
| 20 - 30 | 8 | 25 | 200 |
| 30 - 40 | 4 | 35 | 140 |
| 40 - 50 | 6 | 45 | 270 |
| Total | Σf = 25 | Σfx = 695 |
By formula,
Mean =
= = 27.8
Hence, mean = 27.8
(iii) From table,
Class 20 - 30 has the highest frequency.
Hence, modal class = 20 - 30.
For the data given in the following tables, find :
(i) mean
(ii) mode (using graph)
(iii) median (using graph)
(a)
| Class-mark | Frequency |
|---|---|
| 15 | 10 |
| 25 | 12 |
| 35 | 14 |
| 45 | 16 |
| 55 | 8 |
(b)
| Class-mark | Frequency |
|---|---|
| 35 | 8 |
| 40 | 10 |
| 45 | 12 |
| 50 | 15 |
| 55 | 20 |
| 60 | 15 |
Answer
(a) Since the difference between two consecutive class-marks is 10, subtract = 5 from each class-mark to get the lower limit and add 5 to get the upper limit.
| Class-mark (x) | Class interval | Frequency (f) | fx | Cumulative frequency |
|---|---|---|---|---|
| 15 | 10 - 20 | 10 | 150 | 10 |
| 25 | 20 - 30 | 12 | 300 | 22 |
| 35 | 30 - 40 | 14 | 490 | 36 |
| 45 | 40 - 50 | 16 | 720 | 52 |
| 55 | 50 - 60 | 8 | 440 | 60 |
| Total | Σf = 60 | Σfx = 2100 |
(i) By formula,
Mean = = 35.
Hence, mean = 35.
(ii) Calculating mode :
Steps of construction :
Draw a histogram of the given distribution.
Inside the highest rectangle, which represents the maximum frequency (or modal class) draw two lines AC and BD diagonally from the upper corners C and D of adjacent rectangles.
Through the point K (the point of intersection of diagonals AC and BD), draw KM perpendicular to the horizontal axis.
The value of point M on the horizontal axis represents the value of mode.
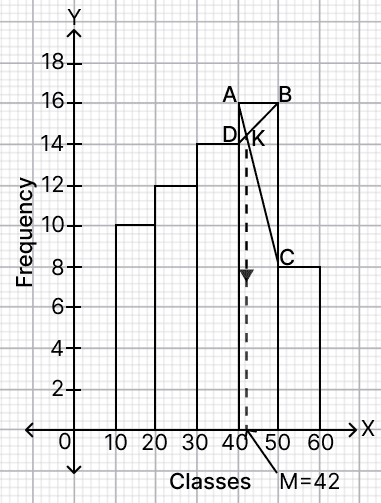
∴ Mode = 42 (approx).
Hence, mode = 42 (approx).
(iii) n = Σf = 60
Median = term = = 30th term.
Steps of construction of ogive :
Take 1 cm = 10 units along x-axis.
Take 1 cm = 10 units along y-axis.
Ogive always starts from a point on x-axis representing the lower limit of the first class. Mark point (10, 0).
Take upper class limits along x-axis and corresponding cumulative frequencies along y-axis, mark the points (20, 10), (30, 22), (40, 36), (50, 52) and (60, 60).
Join the points marked by a free hand curve.
Mark 30 on y-axis, draw a horizontal line which meets the curve at point A.
Through point A, on the curve, draw a vertical line which meets x-axis at point B.
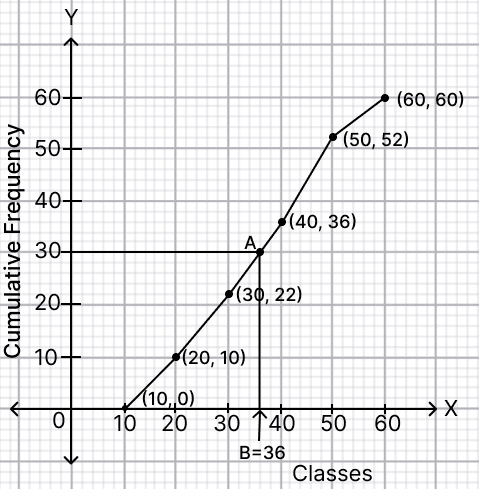
From graph,
B = 36 (approx)
Hence, median = 36 (approx).
(b) Since the difference between two consecutive class-marks is 5, subtract = 2.5 from each class-mark to get the lower limit and add 2.5 to get the upper limit.
| Class-mark (x) | Class interval | Frequency (f) | fx | Cumulative frequency |
|---|---|---|---|---|
| 35 | 32.5 - 37.5 | 8 | 280 | 8 |
| 40 | 37.5 - 42.5 | 10 | 400 | 18 |
| 45 | 42.5 - 47.5 | 12 | 540 | 30 |
| 50 | 47.5 - 52.5 | 15 | 750 | 45 |
| 55 | 52.5 - 57.5 | 20 | 1100 | 65 |
| 60 | 57.5 - 62.5 | 15 | 900 | 80 |
| Total | Σf = 80 | Σfx = 3970 |
(i) By formula,
Mean = = 49.625
Hence, mean = 49.625
(ii) Calculating mode :
Steps of construction :
Draw a histogram of the given distribution.
Inside the highest rectangle, which represents the maximum frequency (or modal class) draw two lines AC and BD diagonally from the upper corners C and D of adjacent rectangles.
Through the point K (the point of intersection of diagonals AC and BD), draw KM perpendicular to the horizontal axis.
The value of point M on the horizontal axis represents the value of mode.
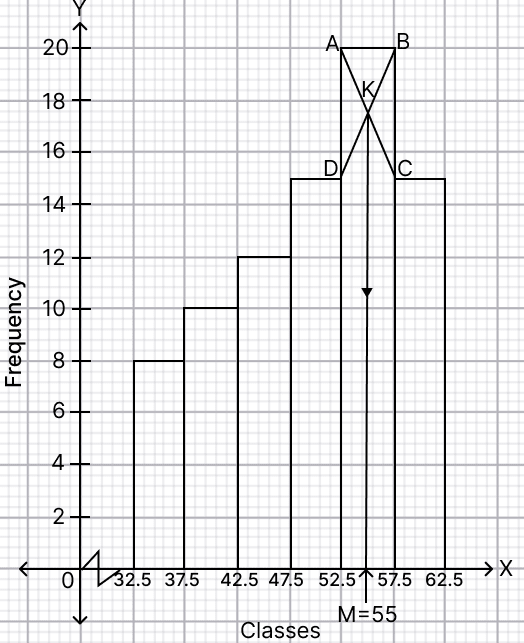
∴ Mode = 55 (approx).
Hence, mode = 55 (approx).
(iii) n = Σf = 80
Median = term = = 40th term.
Steps of construction of ogive :
Take 1 cm = 5 units along x-axis.
Take 1 cm = 10 units along y-axis.
Ogive always starts from a point on x-axis representing the lower limit of the first class. Mark point (32.5, 0).
Take upper class limits along x-axis and corresponding cumulative frequencies along y-axis, mark the points (37.5, 8), (42.5, 18), (47.5, 30), (52.5, 45), (57.5, 65) and (62.5, 80).
Join the points marked by a free hand curve.
Mark 40 on y-axis, draw a horizontal line which meets the curve at point A.
Through point A, on the curve, draw a vertical line which meets x-axis at point B.
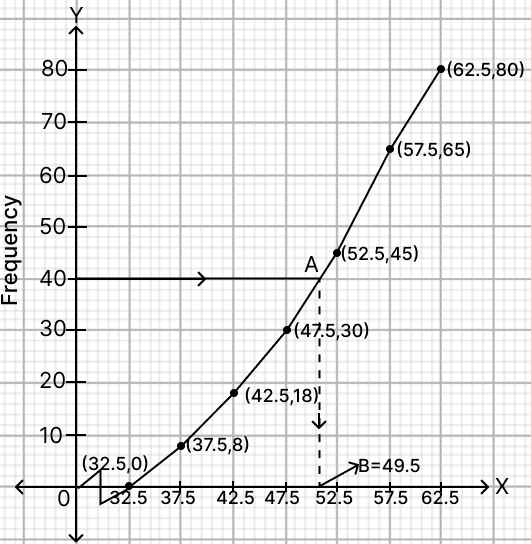
From graph,
B = 49.5 (approx)
Hence, median = 49.5 (approx).
On average, 80 patients get admitted into a nursing home in a day. The ages of the patients admitted and their number are as given below :
| Age (in years) | No. of patients |
|---|---|
| 10 - 20 | 13 |
| 20 - 30 | 23 |
| 30 - 40 | 25 |
| 40 - 50 | 14 |
| 50 - 60 | 5 |
Find :
(i) The average age for which maximum cases occur.
(ii) The upper limit of modal class.
(iii) The mean of the given data.
Answer
(i) The average age for which maximum cases occur is the mode of the distribution.
The maximum frequency is 25, so the modal class is 30 - 40.
Here, l = 30, f1 = 25, f0 = 23, f2 = 14 and h = 10.
By formula,
Hence, the average age for which maximum cases occur is 31.54 years (approx.).
(ii) The modal class is 30 - 40.
Hence, the upper limit of the modal class is 40.
(iii) Mean of the data :
| Age (in years) | Class-mark (x) | No. of patients (f) | fx |
|---|---|---|---|
| 10 - 20 | 15 | 13 | 195 |
| 20 - 30 | 25 | 23 | 575 |
| 30 - 40 | 35 | 25 | 875 |
| 40 - 50 | 45 | 14 | 630 |
| 50 - 60 | 55 | 5 | 275 |
| Total | Σf = 80 | Σfx = 2550 |
By formula,
Mean = = 31.875 ≈ 31.88.
Hence, the mean of the given data is 31.88 years (approx.).
Along with an increase in population, electricity consumption per person is also increasing nationwide.
A survey is conducted for 560 families of Mangal Pande Nagar, Meerut. The following table gives the monthly consumption of electricity of these families.
| Monthly consumption (in units) | No. of families |
|---|---|
| 0 - 100 | 160 |
| 100 - 200 | 120 |
| 200 - 300 | 180 |
| 300 - 400 | 60 |
| 400 - 500 | 40 |
Assuming that no family consumes more than 500 units of electricity, find :
(i) The mean monthly consumption.
(ii) The modal monthly class.
Answer
(i) Mean monthly consumption :
| Monthly consumption (in units) | Class-mark (x) | No. of families (f) | fx |
|---|---|---|---|
| 0 - 100 | 50 | 160 | 8000 |
| 100 - 200 | 150 | 120 | 18000 |
| 200 - 300 | 250 | 180 | 45000 |
| 300 - 400 | 350 | 60 | 21000 |
| 400 - 500 | 450 | 40 | 18000 |
| Total | Σf = 560 | Σfx = 110000 |
By formula,
Mean = = 196.43 (approx.).
Hence, the mean monthly consumption is 196.43 units (approx.).
(ii) The maximum frequency is 180, which corresponds to the class 200 - 300.
Hence, the modal monthly class is 200 - 300.