Analytical and Application Based Questions
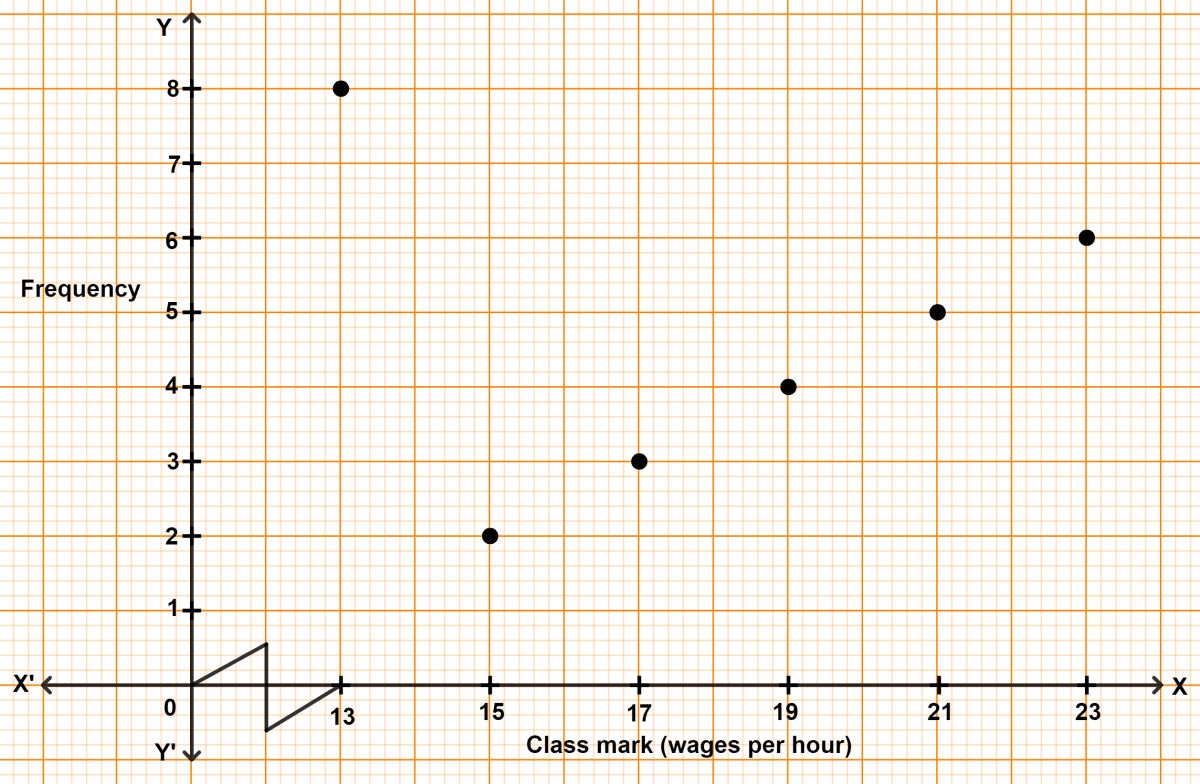
The class mark and frequency of a data is given in the graph. From the graph, Find:
(a) the table showing the class interval and frequency.
(b) the mean
Answer
(a) Class marks : 13, 15, 17, 19, 21, 23.
Difference between two consecutive class marks = 15 - 13 = 2.
Lower limit of class = Class mark - 1
Upper limit of class = Class mark + 1
| Class | Frequency |
|---|
| 12 - 14 | 8 |
| 14 - 16 | 2 |
| 16 - 18 | 3 |
| 18 - 20 | 4 |
| 20 - 22 | 5 |
| 22 - 24 | 6 |
(b)
| Class | Class mark (x) | Frequency (f) | fx |
|---|
| 12 - 14 | 13 | 8 | 104 |
| 14 - 16 | 15 | 2 | 30 |
| 16 - 18 | 17 | 3 | 51 |
| 18 - 20 | 19 | 4 | 76 |
| 20 - 22 | 21 | 5 | 105 |
| 22 - 24 | 23 | 6 | 138 |
| Total | | Σf = 28 | Σfx = 504 |
Mean = ΣfΣfx=28504 = 18.
Hence, mean = 18.
The mean of 5, 7, 8, 4 and n is o and the mean of 5, 7, 8, 4, n and o is n. Find the values of n and o.
Answer
Given,
Mean of 5, 7, 8, 4 and n is o.
By formula,
⇒Mean=n∑xi⇒o=55+7+8+4+n⇒5o=24+n⇒o=524+n .....(1)
Mean of 5, 7, 8, 4, n and o is n.
⇒n=65+7+8+4+n+o⇒6n=24+n+o⇒5n=24+o .....(2)
From equation (1), o = 524+n.
Substituting in equation (2), we get:
⇒5n=24+524+n⇒5n=5120+24+n⇒25n=120+24+n⇒24n=144⇒n=6.
Substituting n = 6 in equation (1), we get:
⇒o=524+6⇒o=530=6.
Hence, n = 6 and o = 6.