
In which of the following examples of motion can the body be considered approximately a point-object?
(a) A railway carriage moving without jerks between two stations.
(b) A monkey sitting on top of a man cycling smoothly on a circular track.
(c) A spinning cricket ball that turns sharply on hitting the ground.
(d) A tumbling beaker that has slipped off the edge of a table.
Answer
The body can be considered approximately a point object when its size is negligible compared to the distance travelled and its rotational motion is not important.
(a) A railway carriage moving without jerks between two stations — Yes
The length of the carriage is very small compared to the distance between the stations, so it can be treated as a point object.
(b) A monkey sitting on top of a man cycling smoothly on a circular track — Yes
If only the motion of the monkey around the circular track is considered, its size is negligible compared to the radius of the track, so it may be treated as a point object.
(c) A spinning cricket ball that turns sharply on hitting the ground — No
The spinning (rotational motion) of the ball affects its motion after bouncing, so its size and rotation cannot be ignored.
(d) A tumbling beaker that has slipped off the edge of a table — No
Since the beaker is tumbling, its rotational motion is significant, and it cannot be treated as a point object.
Answer: (a) and (b).
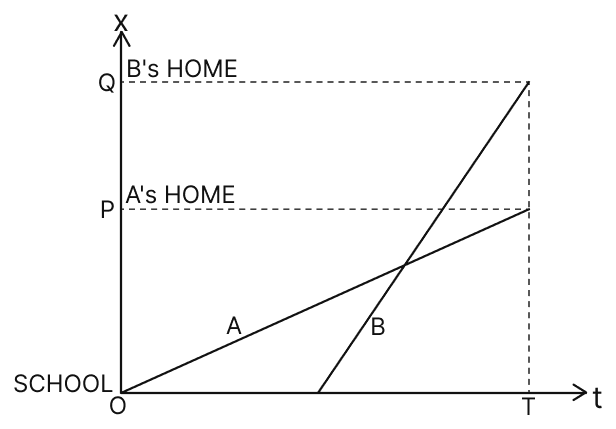
The position-time (x-t) graphs for two children A and B returning from their school O to their homes P and Q respectively are shown in the figure. Choose the correct entries in the brackets below :
(a) (A/B) lives closer to the school than (B/A).
(b) (A/B) starts from the school earlier than (B/A).
(c) (A/B) walks faster than (B/A).
(d) (A and B) reach home at the (same/different) time.
(e) (A/B) overtakes (B/A) on the road (once/twice).
Answer
(a) A lives closer to the school than B.
(b) A starts from the school earlier than B.
(c) B walks faster than A.
(d) A and B reach home at the same time.
(e) B overtakes A on the road once.
Reason —
(a) The distance of A's home from the school is OP and that of B's home is OQ. Since OP is less than OQ, A lives closer to the school than B.
(b) For A, the position is x = 0 at time t = 0, but for B, x = 0 at a later time t > 0. Hence A starts from the school earlier than B.
(c) The speed is given by the slope of the position-time graph. Since the slope of the graph for B is greater than that for A, B walks faster than A.
(d) Corresponding to both the points P and Q, the value of time t is the same. Hence A and B both reach home at the same time.
(e) The graphs for A and B intersect each other only once, so A and B meet each other only once on the way home. Since B starts from the school later than A but walks faster than A, B overtakes A on the road once.
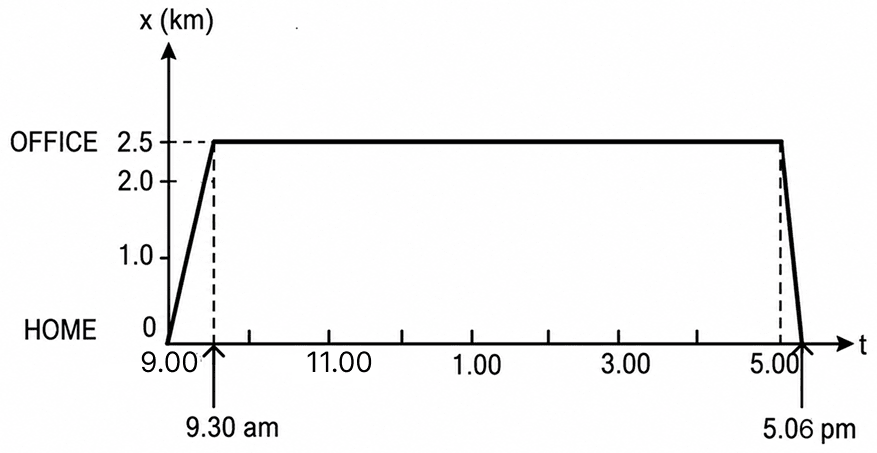
A woman starts from her home at 9.00 am, walks with a speed of 5 km/h on a straight road up to her office 2.5 km away, stays at the office up to 5.00 pm, and returns home by an auto with a speed of 25 km/h. Plot x-t graph for her motion.
Answer
Given,
- Distance of the office from home, s = 2.5 km
- Walking speed while going, v1 = 5 km h-1
- Speed of the auto while returning, v2 = 25 km h-1
- Departure time from home = 9.00 am
To draw the graph we first work out the two travel times.
While going to the office, the time is the distance divided by the walking speed :
So she is at the office by 9.30 am. From 9.30 am until 5.00 pm she does not move, so her position stays fixed at 2.5 km and the graph runs flat during this long interval.
While coming back by auto, the return time is :
Hence she is back home by 5.06 pm.
Plotting position against time, the graph rises from 0 to 2.5 km between 9.00 and 9.30 am, stays constant at 2.5 km up to 5.00 pm, and then drops back to 0 by 5.06 pm, as shown.
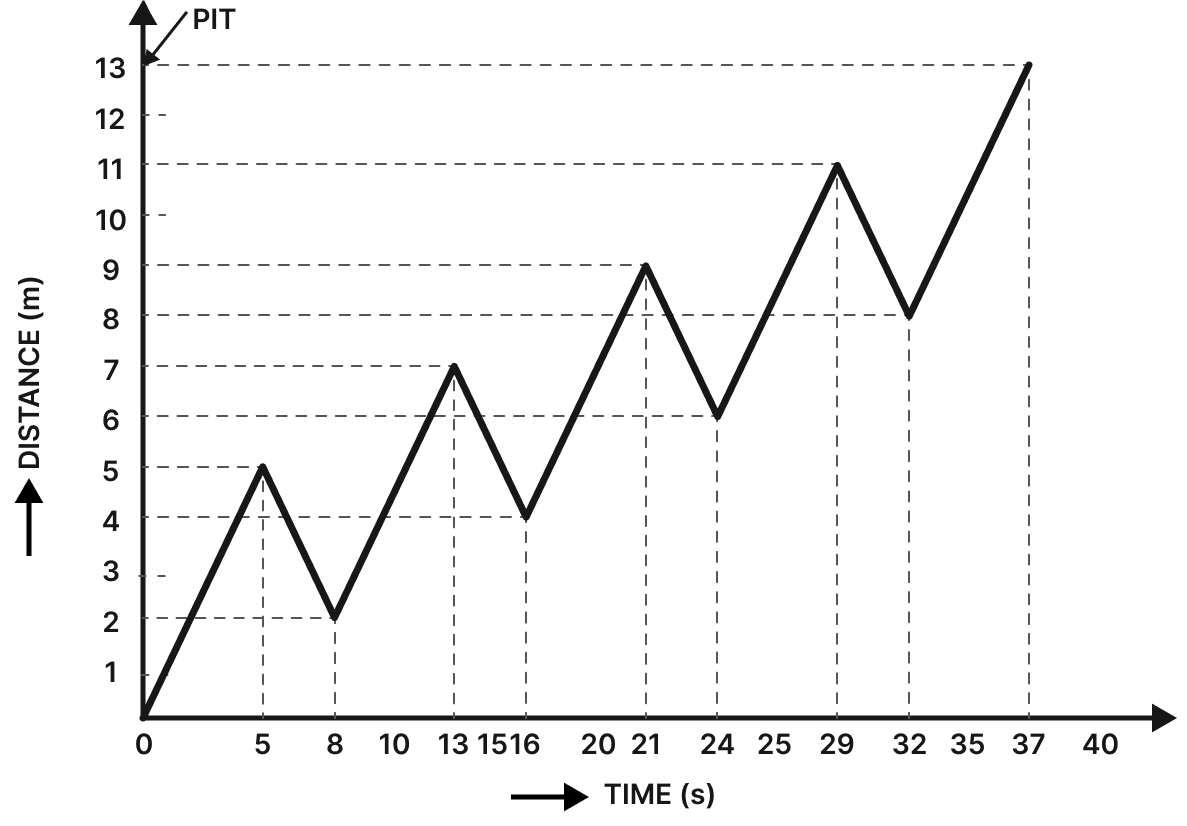
A drunkard walking in a narrow lane takes 5 steps forward and 3 steps backward, followed again by 5 steps forward and 3 steps backward, and so on. Each step is 1 m long and requires 1 s. Plot x-t graph for his motion. Determine graphically and otherwise how long the drunkard takes to fall in a pit 13 m away from start?
Answer
The drunkard takes 37 s to fall into the pit.
Reason —
Given,
- Length of each step = 1 m
- Time for each step = 1 s
- Distance of the pit from the start = 13 m
In one full cycle the man first takes 5 steps ahead, advancing 5 m in 5 s, and then 3 steps back, losing 3 m in 3 s. So every cycle of 8 s carries him a net 2 m forward.
We must be careful near the end : the man falls in the moment he first reaches 13 m, even if that happens midway through a cycle.
Net gain per cycle = 5 - 3 = 2 m in 8 s.
Let us see how far he is after several complete cycles. To leave himself within one forward-swing of the pit, he needs to reach 8 m, because from 8 m a single set of 5 forward steps would carry him to 13 m.
Number of 8 s cycles needed to reach 8 m of net displacement :
Time for these 4 cycles = 4 × 8 = 32 s, at the end of which he stands at 8 m.
From 8 m he now walks 5 steps forward without turning back. The remaining distance is 13 - 8 = 5 m, which takes 5 more seconds.
The same value is read off the x-t graph, where the zig-zag line first touches the 13 m mark at t = 37 s.
A car moving along a straight highway with speed of 126 km h-1 is brought to a stop within a distance of 200 m. What is the retardation of the car (assumed uniform) and how long does it take for the car to stop?
Answer
Given,
- Initial speed, u = 126 km h-1
- Final speed, v = 0 (the car stops)
- Stopping distance, s = 200 m
Before using the equations of motion we convert the speed into SI units :
Finding the retardation. The equation that links the two speeds with the distance (and leaves out time) is v2 = u2 + 2as. Rearranging for a :
The minus sign confirms that the acceleration opposes the motion, so it is a retardation of magnitude 3.06 m s-2.
Finding the stopping time. Using v = u + at and solving for t :
Hence the car decelerates at 3.06 m s-2 and takes about 11.43 s to come to rest.
A player throws a ball upwards with an initial speed of 29.4 m s-1.
(a) What is the direction of acceleration during the upward motion of the ball?
(b) What are the velocity and acceleration of the ball at the highest point of its motion?
(c) To what height does the ball rise and after how long does it return to the player's hands (g = 9.8 m s-2)? Neglect air friction.
Answer
Given,
- Initial velocity, u = 29.4 m s-1 (directed upward)
- Acceleration due to gravity, g = 9.8 m s-2 (directed downward)
(a) Once the ball leaves the hand, the only influence on it is gravity. Gravity pulls everything toward the earth, so throughout the flight — while rising, at the top, and while falling — the acceleration points vertically downward.
(b) At the very top of its path the ball halts for an instant before turning round, so its speed there is zero. Gravity, however, never switches off. Therefore, at the highest point,
Velocity, v = 0 Acceleration, a = 9.8 m s-2, directed vertically downward.
(c) Taking the upward direction as positive, at the highest point v = 0.
Height reached. Using v2 = u2 - 2gh with v = 0 :
Time to reach the top. Using v = u - gt with v = 0 :
Since the downward journey mirrors the upward one, the ball needs the same 3 s to come down. Hence the total time before it lands back in the hand is
So the ball rises to 44.1 m and returns to the player's hands after 6 s.
Read each statement below carefully and state with reasons and examples, if it is true or false : A particle in one-dimensional motion
(a) with zero speed at an instant may have non-zero acceleration at that instant,
(b) with zero speed may have non-zero velocity,
(c) with constant speed must have zero acceleration,
(d) with positive value of acceleration must be speeding up.
Answer
(a) True. Zero speed at an instant only means that the velocity is zero at that instant; it does not tell us the rate of change of velocity. A ball thrown vertically upward has zero velocity at the highest point, but the acceleration due to gravity of 9.8 m s-2 still acts on it at that instant.
(b) False. Speed is the magnitude of velocity. If the magnitude of the velocity is zero, the velocity itself is zero, since a velocity of zero magnitude cannot have any direction.
(c) True. In one-dimensional motion, a constant speed means that the magnitude and direction of the velocity both remain unchanged, so the acceleration is zero. (A change of direction while keeping the same speed would require an instantaneous reversal, that is, an infinite acceleration, which is not physically possible.)
(d) False. A positive acceleration increases the speed only when the body moves in the positive direction. If the body moves in the negative direction, a positive acceleration opposes the motion and decreases the speed. For example, a body moving with negative velocity and positive acceleration slows down.
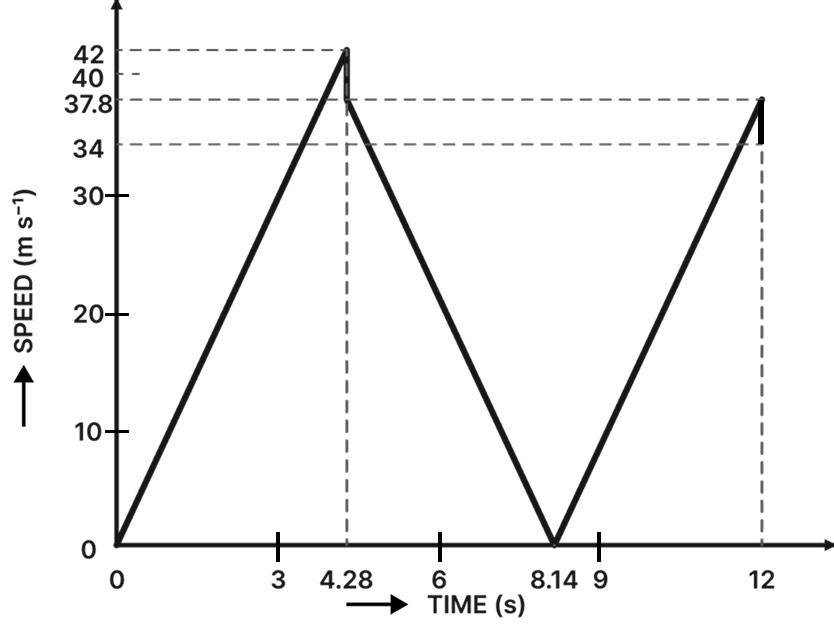
A ball is dropped from a height of 90 m on a floor. At each collision with the floor, the ball loses one-tenth of its speed. Plot the speed-time graph of its motion between t = 0 to 12 s.
Answer
Given,
- Height of fall, h = 90 m
- Initial velocity, u = 0
- Acceleration due to gravity, g = 9.8 m s-2
- Fractional loss of speed at each bounce = one-tenth
Speed and time for the first fall. Using h = ut + gt2 with u = 0 :
The speed on striking the floor, from v = u + gt :
After the first bounce. The ball keeps nine-tenths of its speed :
It rises with this speed and stops after a time t', where, from v = u - gt with final velocity 0 :
Coming down again it regains 37.8 m s-1 at the floor and takes another 3.86 s. So the running total of time is
Just after the second bounce the speed becomes
Collecting these values :
| Time | Speed |
|---|---|
| 0 | 0 |
| 4.28 s | 42 m s-1 → 37.8 m s-1 |
| 8.14 s | 0 |
| 12 s | 37.8 m s-1 → 34 m s-1 |
Plotting speed against time gives a series of straight sloping lines: the speed climbs at 9.8 m s-1 per second during each fall and drops at the same rate during each rise, with a sudden step down at every bounce. The graph is drawn as shown.
Explain clearly, with examples, the distinction between :
(a) magnitude of displacement (sometimes called distance) over an interval of time and the total length of path covered by a particle over the same interval;
(b) magnitude of average velocity over an interval of time and the average speed over the same interval. [Average speed of a particle over an interval of time is defined as the total path length divided by the time interval].
Show in both (a) and (b) that the second quantity is either greater than or equal to the first. When is the equality sign true? [For simplicity, consider one-dimensional motion only].
Answer
(a) Magnitude of displacement and total length of path.
The magnitude of displacement is the shortest distance between the initial and final positions of the particle, and displacement is a vector quantity. The total length of path is the actual distance covered by the particle along its path, and it is a scalar quantity.
Example : Let a particle move from A (0 m) to B (4 m) and then return to C (2 m).
- Magnitude of displacement = final position - initial position = 2 - 0 = 2 m.
- Total length of path = (A to B) + (B to C) = 4 + 2 = 6 m.
Since the total length of path includes the whole distance covered while the magnitude of displacement is only the net change in position, the total length of path is always greater than or equal to the magnitude of displacement.
The two are equal when the particle moves along a straight line in one direction without reversing. If it moves straight from A (0 m) to B (4 m), both quantities are equal to 4 m.
(b) Magnitude of average velocity and average speed.
Example : Let the same particle take 2 s from A (0 m) to B (4 m) and 1 s from B to C (2 m).
Displacement = 2 m, total length of path = 6 m, total time interval = 3 s.
Since both are divided by the same time interval, and the total length of path is always greater than or equal to the magnitude of displacement, the average speed is always greater than or equal to the magnitude of average velocity.
The two are equal only for motion along a straight line in one direction without reversal. For example, moving from A to B (4 m in 2 s) gives average velocity = average speed = 2 m s-1.
A man walks on a straight road from his home to market 2.5 km away with a speed of 5 km h-1. Finding the market closed, he instantly turns and walks back with a speed of 7.5 km h-1. What is the magnitude of average velocity, and average speed of the man over the interval of time (i) 0 to 30 min, (ii) 0 to 50 min, (iii) 0 to 40 min?
Answer
Given,
- One-way distance, home to market, s = 2.5 km
- Speed while going, v1 = 5 km h-1
- Speed while returning, v2 = 7.5 km h-1
First we find how long each leg of the trip lasts.
Time to reach the market :
Time to walk back :
So he reaches the market at the 30 min mark and is home again at the 50 min mark.
(i) From 0 to 30 min. He is still on his way out, having covered 2.5 km in one direction. Here distance and displacement are both 2.5 km.
(ii) From 0 to 50 min. By now he has gone out and come back, ending where he started.
Displacement = 0, and distance = 2.5 + 2.5 = 5 km.
Time = 50 min = h.
(iii) From 0 to 40 min. The first 30 min take him 2.5 km out; the next 10 min bring him partway back. In those 10 min at 7.5 km h-1 he covers
So displacement = 2.5 - 1.25 = 1.25 km, and distance = 2.5 + 1.25 = 3.75 km.
Time = 40 min = h.
In Exercises 9 and 10, we have carefully distinguished between average speed and magnitude of average velocity. No such distinction is necessary when we consider instantaneous speed and magnitude of velocity. The instantaneous speed is always equal to the magnitude of instantaneous velocity. Why?
Answer
The distinction between average speed and magnitude of average velocity arises because, over a time interval, the total length of path and the magnitude of displacement can be different. The instantaneous speed and the magnitude of instantaneous velocity are measured over an infinitesimally small time interval, and in such a small interval the particle cannot reverse its direction. Over this interval the length of path covered and the magnitude of displacement become equal, so the instantaneous speed is always equal to the magnitude of instantaneous velocity.
Example : If a car has an instantaneous velocity of + 10 m s-1 or - 10 m s-1 at an instant, its instantaneous speed at that instant is 10 m s-1 in both cases; only the direction (sign) is left out.
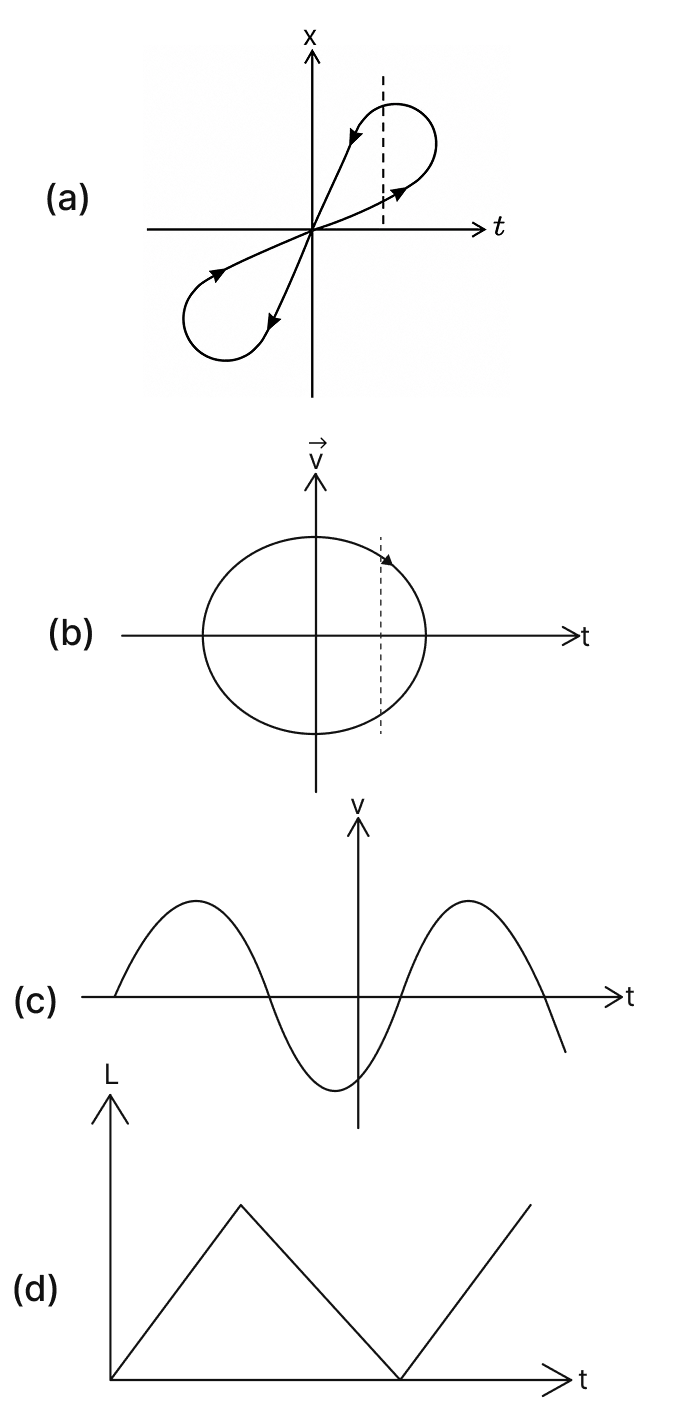
The following graphs (a), (b), (c) and (d) show respectively the position-time (x-t), velocity-time (-t), speed-time (v-t) and path length-time (L-t) relations. Which of these cannot possibly represent one-dimensional motion of a particle, and why?
Answer
None of the four graphs can describe the one-dimensional motion of a particle.
(a) A vertical line drawn at some instant meets the curve at two places, implying the particle occupies two positions at the same time. A single particle cannot be in two spots at once, so this is impossible. (The arrows on the curve carry no physical meaning.)
(b) Here too a vertical line cuts the graph twice, so the particle would need a positive and a negative velocity simultaneously — motion in two opposite directions at the same instant. That cannot happen in one-dimensional motion.
(c) The curve dips below the axis, showing negative speeds at certain moments. Speed is the magnitude of velocity and can never be negative, so this graph is unphysical.
(d) After a while the total path length L on this graph begins to fall. Path length is a running total of distance covered and can only increase or stay constant; it can never decrease. Hence this graph is impossible.
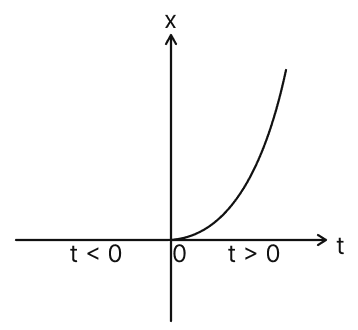
The figure shows the x-t plot of one-dimensional motion of a particle. Is it correct to say from the graph that the particle moves in a straight line for t < 0 and on a parabolic path for t > 0? If not, suggest a suitable physical context for this graph.
Answer
No, it is not correct.
A position-time (x-t) graph shows how the position of the particle changes with time; it does not represent the actual path of the particle in space. Hence the shape of the graph, whether straight or parabolic, describes the variation of position with time, not the geometrical path followed by the particle.
A suitable physical context for this graph is a particle at rest at x = 0 up to t = 0, which is then released and falls freely under gravity. During the free fall the distance covered is directly proportional to the square of time, which gives the parabolic part of the graph for t > 0, while for t < 0 the particle remains at rest at the origin.
A police van moving on a highway with a speed of 30 km h-1 fires a bullet at a thief's car speeding away in the same direction with a speed of 192 km h-1. If the muzzle speed of the bullet is 150 m s-1, with what speed does the bullet hit the thief's car? (Note : Obtain that speed which is relevant for damaging the thief's car).
Answer
Given,
- Speed of the police van, vvan = 30 km h-1
- Speed of the thief's car, vthief = 192 km h-1
- Muzzle speed of the bullet (relative to the van), vmuzzle = 150 m s-1
First convert the two vehicle speeds into SI units :
Step 1 — Speed of the bullet relative to the ground. The bullet leaves the gun at 150 m s-1 relative to the van, and the van is itself moving forward, so the two speeds add :
Step 2 — Speed of the bullet relative to the thief's car. The damage-causing speed is the bullet's speed as seen from the fleeing car, which is the difference of the two ground speeds (both point the same way) :
Hence the bullet strikes the thief's car at a relative speed of 105 m s-1.
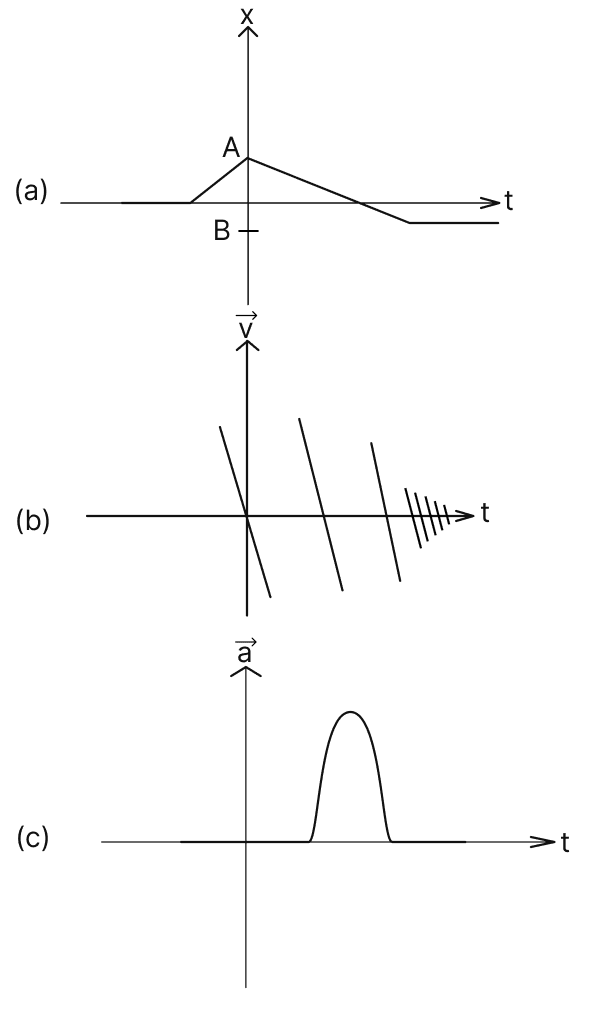
Suggest a suitable physical situation for each of the following graphs :
Answer
(a) In this position-time graph, the position x remains zero for some time, then increases to a maximum value A, then decreases at a smaller rate to zero, then increases in the opposite direction (negative) at the same smaller rate, and finally becomes constant at a value B. This may represent a ball lying at rest on a smooth floor which is kicked towards a wall; it rebounds from the wall with reduced speed, moves to the opposite wall and comes to rest there.
(b) In this velocity graph, the velocity changes its direction repeatedly, and its magnitude decreases each time. This may represent a ball thrown vertically upward which rebounds repeatedly from the floor with reduced velocity after each impact.
(c) In this acceleration graph, the acceleration is zero except for a short interval of time. This may represent a ball moving with uniform velocity which is struck by a bat for a very short interval of time, the short-lived acceleration being the impact that reverses its motion.
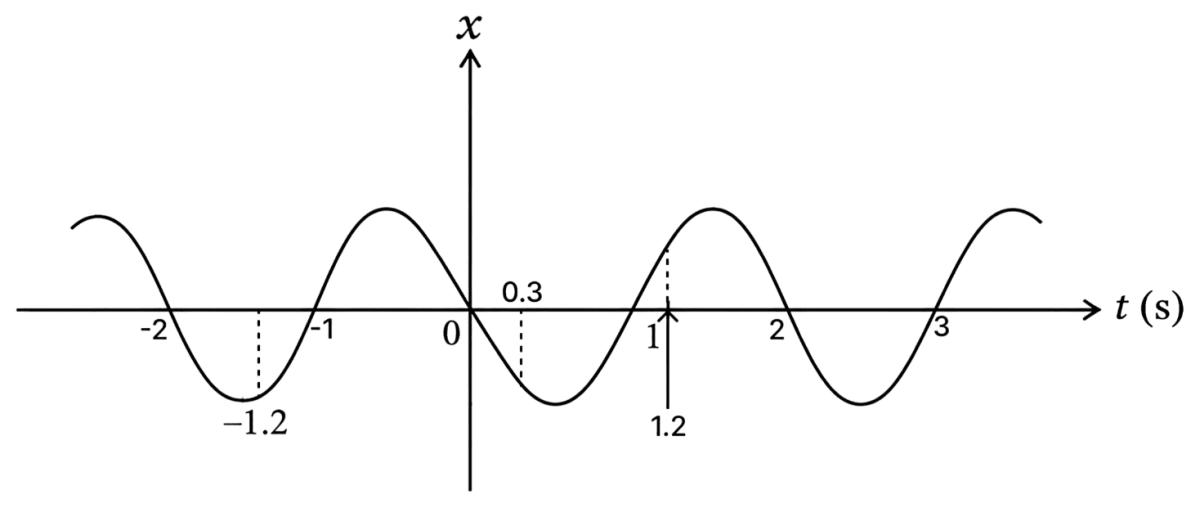
The figure gives the x-t plot of a particle executing one-dimensional simple harmonic motion. Give the acceleration variables of the particle at t = 0.3 s, 1.2 s, - 1.2 s.
Answer
For a particle in simple harmonic motion, the acceleration always points back toward the mean position, that is, opposite to the displacement x. Also, the slope of the x-t graph at any moment gives the velocity there. Using these two ideas :
At t = 0.3 s : The graph shows x below the axis, so x is negative (x < 0). The slope at this point is negative, so v is negative (v < 0). Since acceleration opposes displacement, a is positive (a > 0).
At t = 1.2 s : Here x is above the axis, so x is positive (x > 0), and the slope is positive, so v is positive (v > 0). Acceleration, being opposite to x, is negative (a < 0).
At t = - 1.2 s : The curve gives x negative (x < 0) with a positive slope, so v is positive (v > 0). Since x is negative, the acceleration is positive (a > 0).
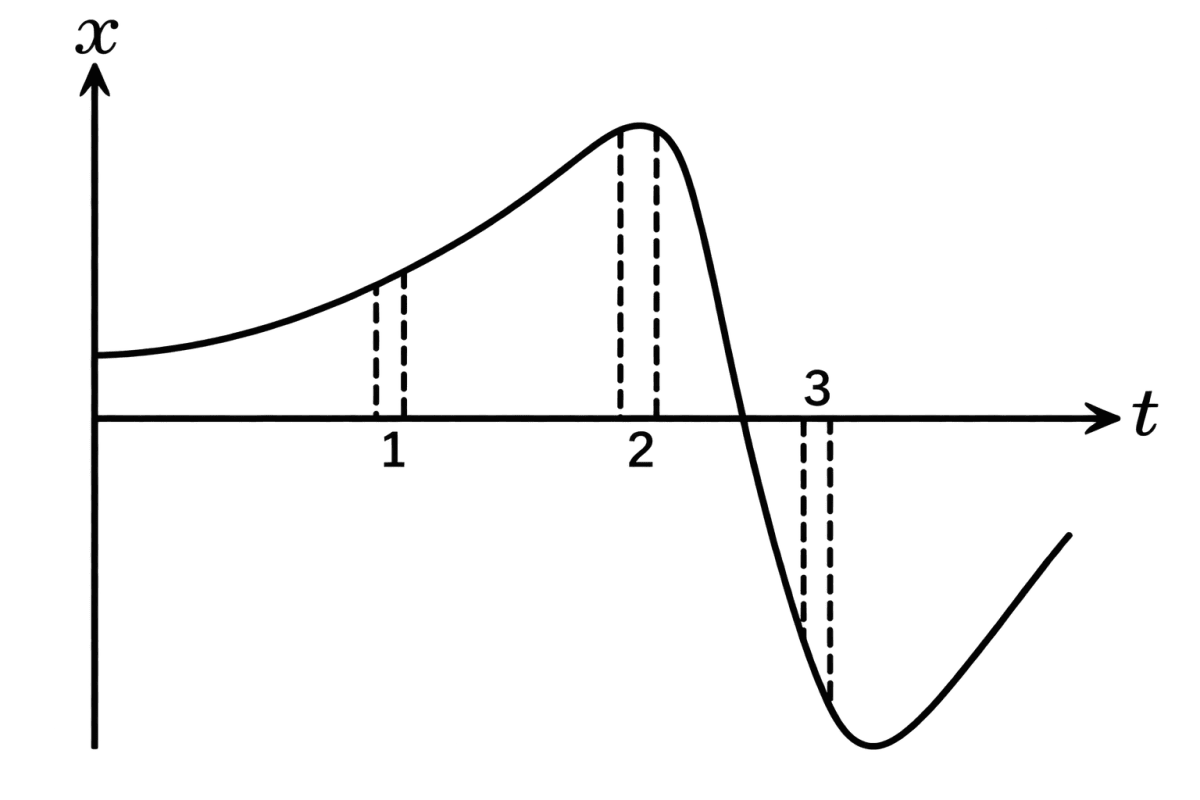
The following figure gives x-t plot of a particle in one-dimensional motion. Three different equal intervals of time are shown. In which interval is the average speed greatest, and in which is it the least? Give the sign of average velocity for each interval.
Answer
On a position-time graph, the steepness (magnitude of the slope) over a small stretch tells us the average speed there. Reading the three marked stretches, the curve is steepest in interval 3 and flattest in interval 2. Therefore the average speed is greatest in interval 3 and least in interval 2.
For the direction, we look at the sign of the slope. The graph rises (positive slope) through intervals 1 and 2, but falls (negative slope) in interval 3. So the average velocity is positive in intervals 1 and 2 and negative in interval 3. Speed stays positive throughout, since it ignores direction.
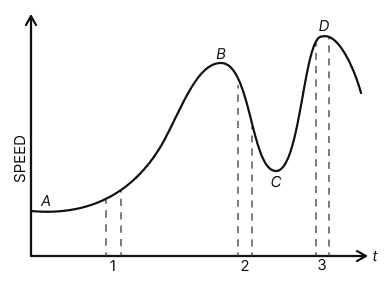
The figure shown, gives a speed-time graph of a particle in motion along a constant direction. Three equal intervals of time are shown. In which interval is the average acceleration greatest in magnitude? In which interval is the average speed greatest? Choosing the positive direction as the constant direction of motion, give the signs of v and a in the three intervals. What are the accelerations at the points A, B, C and D.
Answer
Greatest average acceleration. Average acceleration over an interval is the change in speed divided by the time, . As the three intervals last equally long, we just compare how steeply the speed curve rises or falls in each.
- Interval 1 (A to B) : speed rises → positive acceleration.
- Interval 2 (B to C) : speed drops sharply → negative acceleration, and this fall is the steepest.
- Interval 3 (C to D) : speed rises again → positive acceleration, but less steeply than in interval 1.
Because interval 2 has the steepest change, the average acceleration is greatest in magnitude in interval 2 (B to C).
Greatest average speed. With direction fixed, the average speed over an interval goes with the area under the speed-time curve for that interval.
- Interval 1 : a moderate area.
- Interval 2 : the speed is falling, so the area is small.
- Interval 3 : high speeds are held for the whole interval, giving the largest area.
So the average speed is greatest in interval 3 (C to D).
Signs of v and a. The motion never reverses, so the speed is positive throughout (v > 0); only a changes sign.
| S. No. | Interval | Sign of speed (v) | Sign of acceleration (a) |
|---|---|---|---|
| 1. | (A - B) | + | + (speed rising) |
| 2. | (B - C) | + | - (speed falling) |
| 3. | (C - D) | + | + (speed rising) |
Accelerations at A, B, C, D. The acceleration at a point is the slope of the speed-time curve there.
- Point A : the curve is just starting to rise → positive slope ⇒ positive acceleration.
- Point B : a crest (maximum speed) ⇒ zero slope ⇒ acceleration = 0.
- Point C : a trough (minimum speed) ⇒ zero slope ⇒ acceleration = 0.
- Point D : another crest ⇒ zero slope ⇒ acceleration = 0.
Thus the acceleration is positive at A and zero at each of B, C and D.