
The data represented through the pictures of objects is called
line graph
bar graph
pictograph
none of these
Answer
The representation of data through pictures of objects is called a pictograph.
Hence, option 3 is the correct option.
A graph drawn using vertical bars is called
a line graph
a bar graph
a pictograph
none of these
Answer
A graph drawn using bars (rectangles) of equal width with equal spacing between them is called a bar graph.
Hence, option 2 is the correct option.

325 pens
650 pens
390 pens
71 pens
Answer
One symbol represents 65 pens.
The second figure has 6 such symbols.
∴ Number of pens represented = 6 × 65
= 390
Hence, option 3 is the correct option.

5
72
15
6
Answer
One symbol represents 18 balloons.
∴ Number of symbols required for 90 balloons =
= 5
Hence, option 1 is the correct option.

12
14
16
21
Answer
6 symbols stand for 42 articles.
∴ 1 symbol stands for = 7 articles.
∴ 2 symbols stand for 2 × 7 = 14 articles.
Hence, option 2 is the correct option.
The sizes of shoes of 8 students of a class are given as 4, 6, 4, 5, 4, 5, 6, 5. If the shoe of size less than 5 is observed for girls, then how many boys are there in the list?
3
4
5
6
Answer
Total number of students = 8
Shoe sizes less than 5 are 4, 4 and 4, i.e. 3 students, which are observed for girls.
∴ Number of girls = 3
∴ Number of boys = 8 − 3
= 5
Hence, option 3 is the correct option.
Number of children in 10 families are given as 2, 1, 2, 1, 3, 3, 2, 3, 2, 1. The number of families having less than 3 children is
3
4
7
5
Answer
Families having less than 3 children are those having 1 or 2 children.
In the given data, 1 occurs 3 times and 2 occurs 4 times.
∴ Number of families having less than 3 children = 3 + 4
= 7
Hence, option 3 is the correct option.
A graph drawn using vertical bars is called
bar graph
line graph
pictograph
none of these
Answer
A graph drawn using vertical bars (rectangles) of equal width with equal spacing between them is called a bar graph.
Hence, option 1 is the correct option.
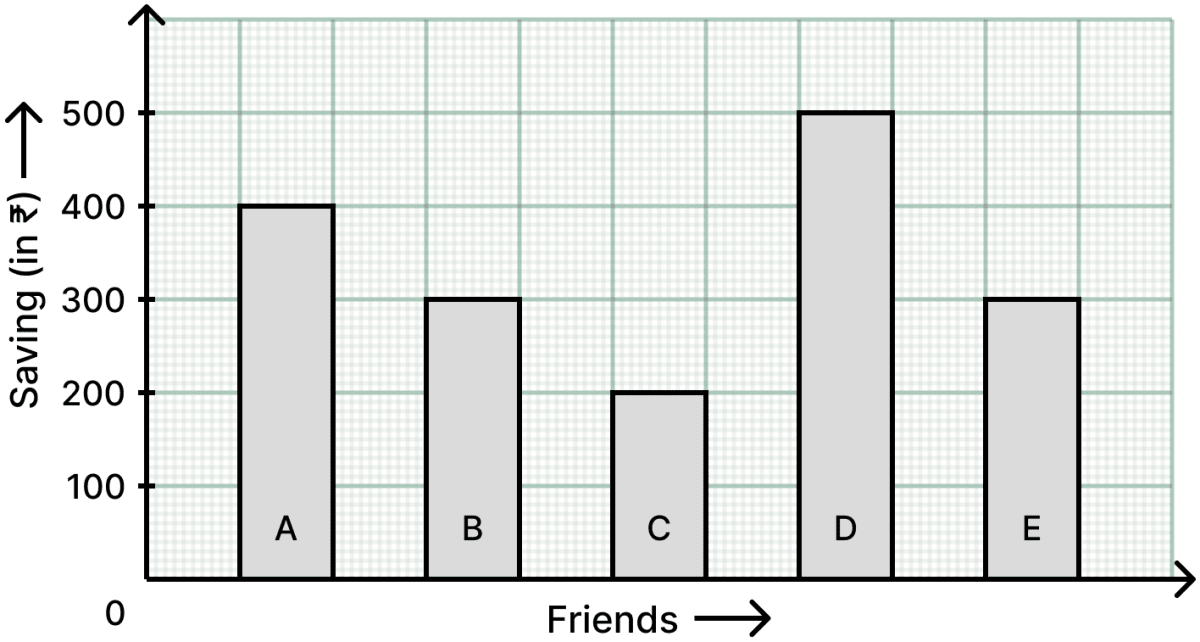
The given bar graph shows the savings of 5 friends. A, B, C, D and E. The ratio of the amounts saved by B and D is
2 : 2
4 : 5
3 : 5
2 : 5
Answer
From the bar graph,
Amount saved by B = ₹ 300
Amount saved by D = ₹ 500
∴ Required ratio =
=
= 3 : 5
Hence, option 3 is the correct option.
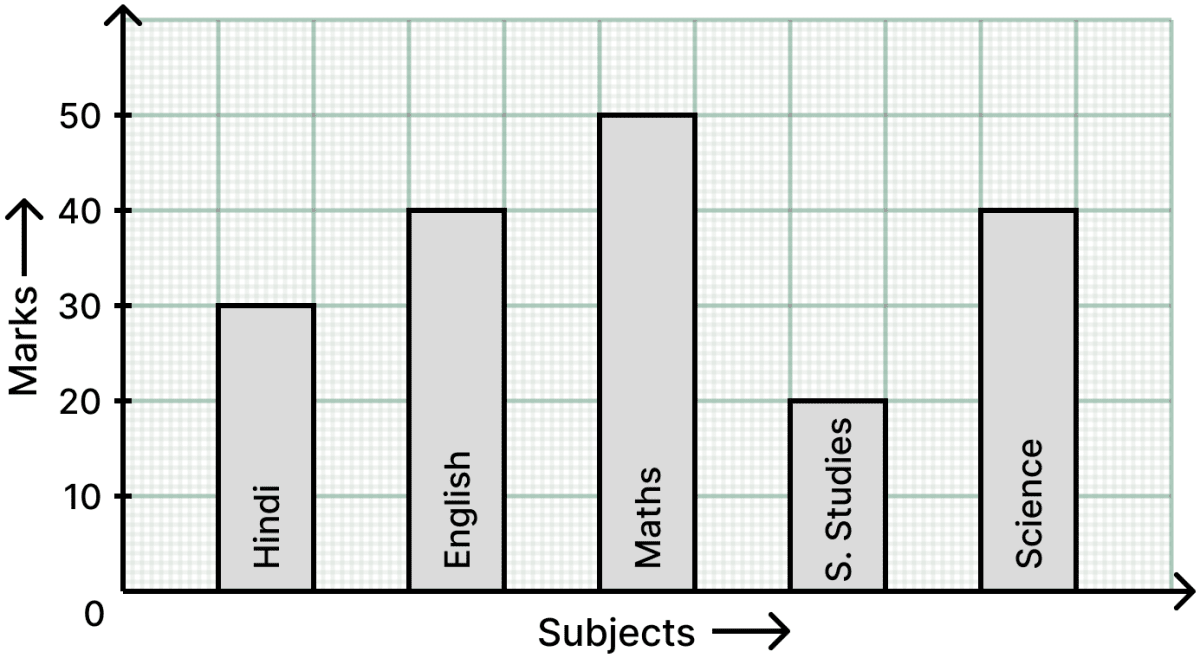
The following graph shows the marks obtained by a student in different subjects. If 35 marks are needed to pass in a subject, then the student failed in
Social Studies
Hindi
Hindi and Social Studies
None of these
Answer
From the bar graph, the marks obtained are :
Hindi = 30, English = 40, Maths = 50, S. Studies = 20 and Science = 40.
Since 35 marks are needed to pass in a subject, the student failed in the subjects in which he scored below 35 marks.
The marks in Hindi (30) and Social Studies (20) are below 35.
∴ The student failed in Hindi and Social Studies.
Hence, option 3 is the correct option.