
Fill in the blanks
(a) ............... maps are prepared on the basis of a detailed survey of the areas concerned.
(b) ............... refers to the ratio of the distances on the map and the corresponding actual distance on the ground.
(c) Contour lines depict the ............... features of a place.
(d) A ............... scale is used for showing details of an area.
(e) ............... and ............... on the topographical map indicate the exact location of a place.
Answer
(a) Topographical maps are prepared on the basis of a detailed survey of the areas concerned.
(b) Map scale refers to the ratio of the distances on the map and the corresponding actual distance on the ground.
(c) Contour lines depict the physical features of a place.
(d) A large scale is used for showing details of an area.
(e) Latitudes and longitudes on the topographical map indicate the exact location of a place.
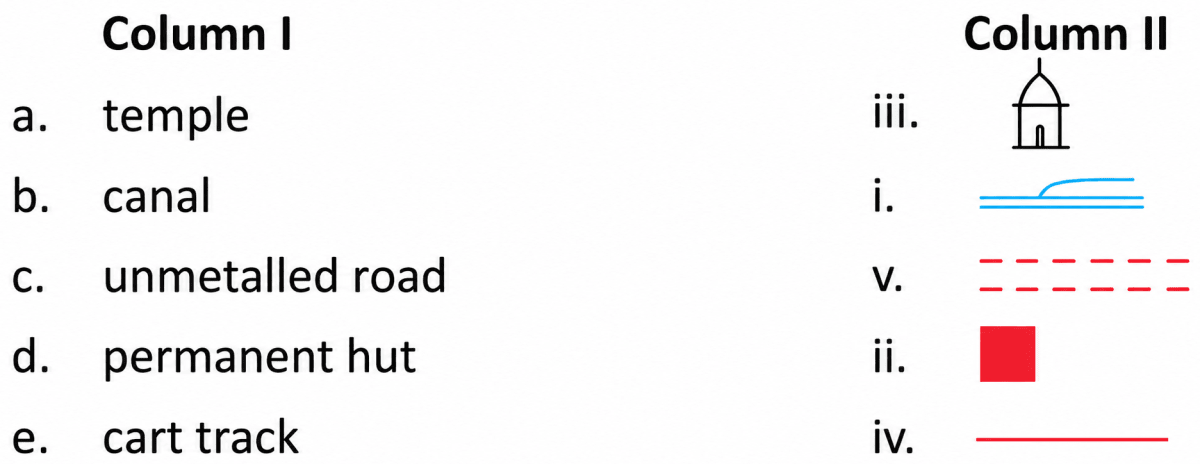
Match the following:
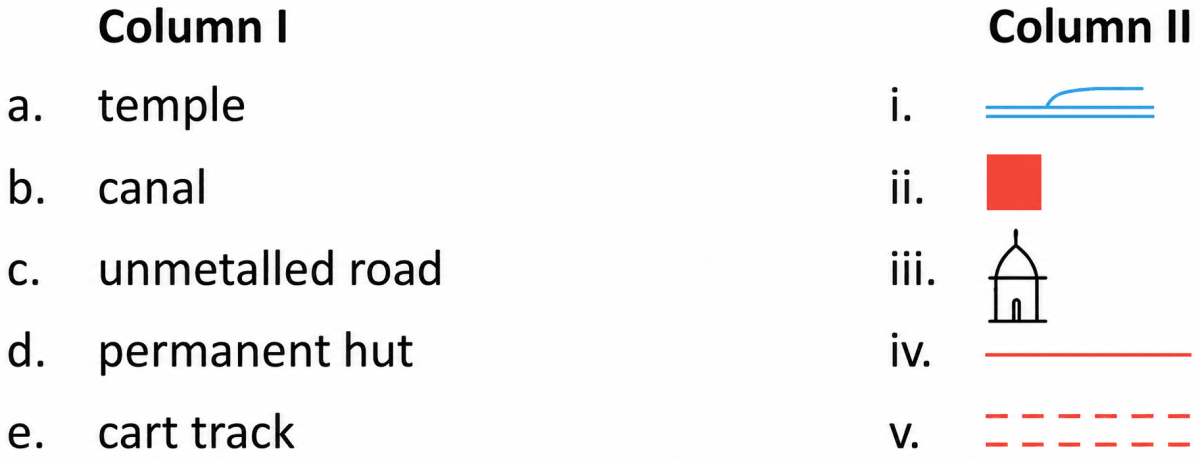
Answer
State whether the following statements are 'true' or 'false'. Rewrite the false statements to correct them.
(a) A map represents the spherical Earth on a flat paper.
(b) A scale written in a statement form like 2 cm to a km is called a representative fraction.
(c) When we need to measure distance along a curved line, we first mark the two points whose distance is to be measured.
(d) Maps use signs and symbols that are not accepted internationally to depict certain features and characteristics.
(e) Drainage features include all natural and human-made water features.
Answer
(a) True
(b) False
Correct Statement — A scale written in a statement form like 2 cm to a km is called a verbal statement.
(c) True
(d) False
Correct Statement — Maps use signs and symbols that are accepted internationally to depict certain features and characteristics.
(e) True
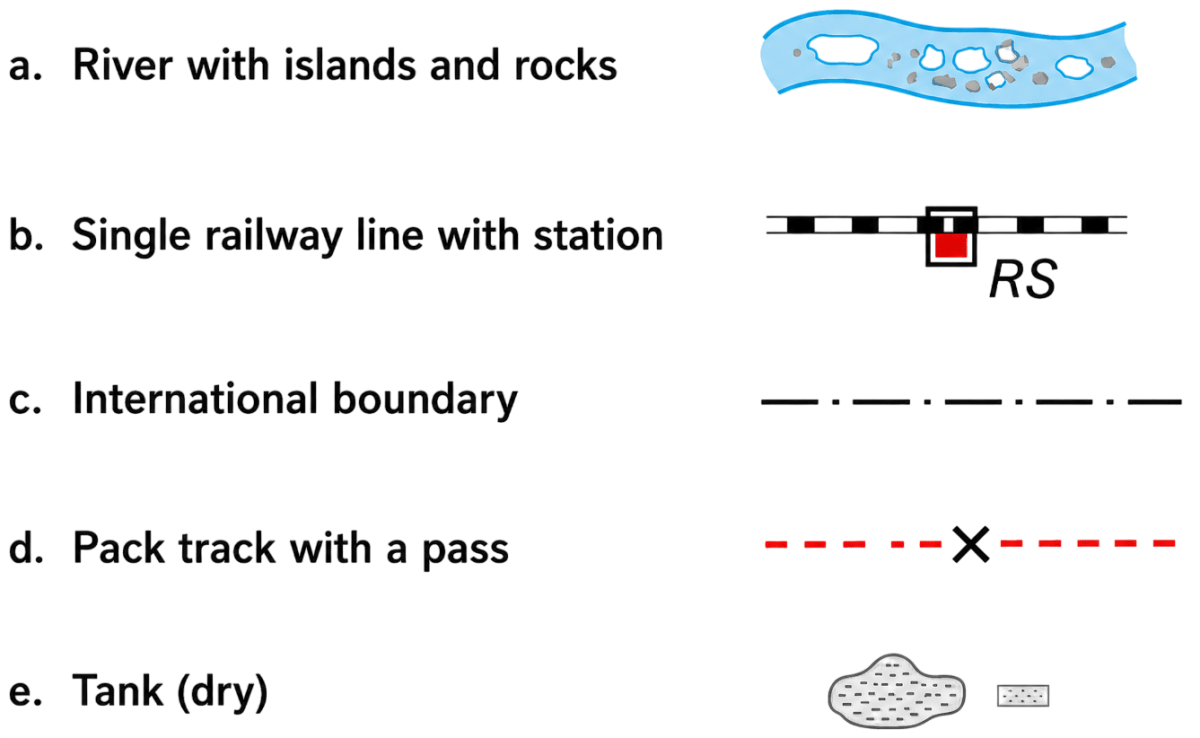
Draw the symbols of the following.
(a) river with islands and rocks
(b) single railway line with station
(c) international boundary
(d) pack track with a pass
(e) tank (dry)
Answer
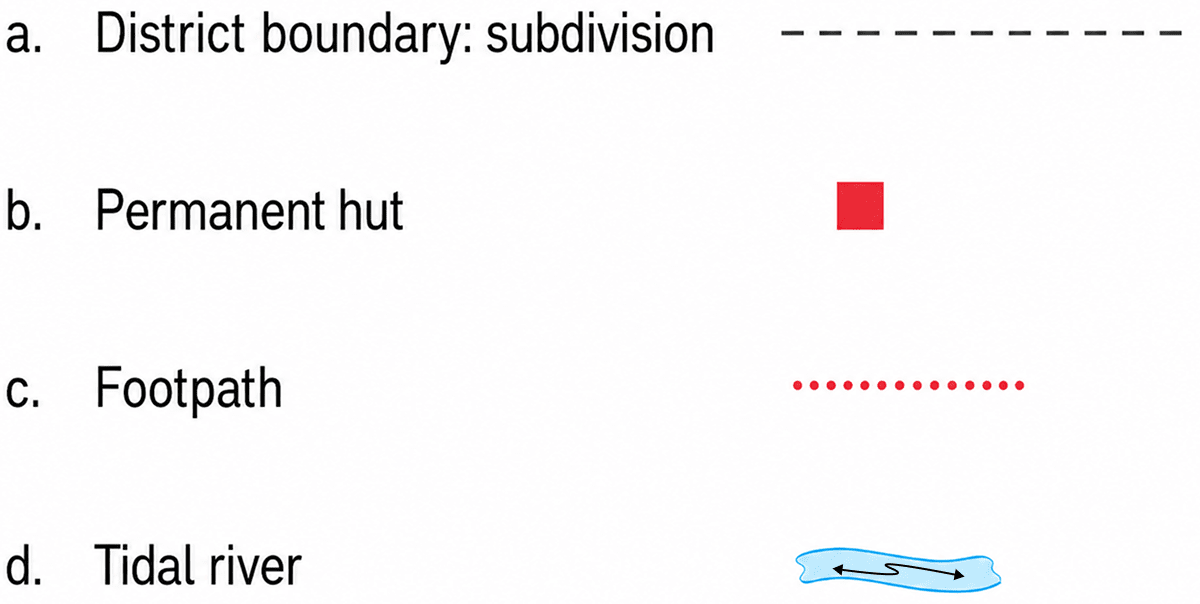
Draw conventional symbols of the following physical features.
(a) district boundary: subdivision
(b) permanent hut
(c) footpath
(d) tidal river
Answer
What features do yellow, brown and red represent on topographical maps?
Answer
On topographical maps, these colours represent the following features:
- Yellow — arable or agricultural lands.
- Brown — contour lines and their heights, and sand features such as sand dunes.
- Red — settlements, grid lines, and all roads including cart tracks or metalled roads.
What is meant by a representative fraction?
Answer
A scale can be written as a representative fraction (R.F.). It is a fraction in which the numerator is the distance on the map and the denominator represents the corresponding actual distance on the ground. For example, 1:50,000 means that 1 cm on the map represents 50,000 cm or 0.5 km on the ground.
How is distance measured along a straight line on the map using scales?
Answer
If we know the scale of the map, we can measure the ground distance between any two places shown on it. To measure the distance along a straight line, we first measure it with a divider. The divider is then placed on the ruler to get the exact map distance in centimetres. Based on the scale given for the map, this map distance is used to calculate the ground distance between the two points in metres and kilometres.
Why are conventional symbols used?
Answer
Maps use a set of standard signs and symbols that are internationally accepted to depict certain features and characteristics. These are known as conventional symbols. With the help of these symbols, it becomes very easy to read and understand a map.
How many types of scales are there? Name them.
Answer
There are three types of scales. They are:
- Verbal statement
- Representative fraction
- Linear scale
Which colour is used to represent arable or agricultural lands on the topographical maps?
- yellow
- white
- brown
- red
Answer
yellow
Reason — Yellow is used to represent arable or agricultural lands. White denotes waste or barren lands, brown shows contour lines and sand features such as sand dunes, and red shows settlements, grid lines and roads.
Choose the correctly matched pair.
- white-forested area
- red-settlement
- blue-surveyed tree
- brown-cart track
Answer
red-settlement
Reason — Red is used for settlements, grid lines and all roads, so red-settlement is correctly matched. White represents waste or barren lands and not forested areas (forests are shown in green); surveyed trees are shown in black and not blue; and cart tracks are shown in red and not brown.
If 1 cm represents 1 km on a map, what is the scale of that map?
- 1:100,000
- 1:10,000
- 1:1,000
- 1:10,000
Answer
1:100,000
Reason — 1 km is equal to 100,000 cm. So if 1 cm on the map represents 1 km on the ground, the scale is 1:100,000.
Contour lines depict the ............... features of a place.
- political
- physical
- landform
- landscape
Answer
physical
Reason — Contour lines depict the physical features and the height of a place.
Complete the relationship.
transport and communication : black lines :: latitudes and longitudes : ...............
- yellow lines
- red lines
- brown lines
- black lines
Answer
black lines
Reason — Black is used for latitudes and longitudes. Black lines are also used to show railway tracks under transport and communication.
Each land use is depicted by means of a ...............
- symbol
- colour
- sign
- logo
Answer
colour
Reason — Each land use is depicted by means of a colour. For example, yellow depicts agricultural land and white denotes barren land.
Which colour is used to represent different kinds of vegetation?
- brown
- black
- green
- white
Answer
green
Reason — Green is used to represent different kinds of vegetation such as forests, types of trees, scrub and orchards.
Identify this symbol.

- Post Office
- Police Station
- Inspection Bungalow
- Circuit House
Answer
Post Office
Reason — The symbol shown is the conventional symbol for a Post Office.
Assertion (A): A map represents the spherical Earth on a flat paper.
Reason (R): The different kinds of maps show different features of the Earth.
- A is true, but R is false.
- A is false, but R is true.
- Both A and R are true, but R is not the correct explanation of A.
- Both A and R are true, and R is the correct explanation of A.
Answer
Both A and R are true, but R is not the correct explanation of A.
Explanation — A map does represent the spherical Earth on a flat paper, and it is also true that different kinds of maps show different features of the Earth. However, R only tells us about the variety of features shown by different maps; it does not explain how or why a map represents the spherical Earth on a flat paper. Hence, R is not the correct explanation of A.
Assertion (A): Lines that are drawn horizontally are called northings.
Reason (R): The number of northings increase northwards.
- A is true, but R is false.
- A is false, but R is true.
- Both A and R are true, but R is not the correct explanation of A.
- Both A and R are true, and R is the correct explanation of A.
Answer
Both A and R are true, and R is the correct explanation of A.
Explanation — Lines that are drawn horizontally on the grid are indeed called northings, and they are given this name because their numbers increase northwards. Hence, R correctly explains why these horizontal lines are called northings.
Assertion (A): Yellow depicts agricultural land.
Reason (R): Each land use is depicted by means of a colour.
- A is true, but R is false.
- A is false, but R is true.
- Both A and R are true, but R is not the correct explanation of A.
- Both A and R are true, and R is the correct explanation of A.
Answer
Both A and R are true, and R is the correct explanation of A.
Explanation — Yellow does depict agricultural land, and this happens because each land use is depicted by means of a colour. Yellow being used for agricultural land is a direct example of this rule, so R correctly explains A.
Give reason — Topographical maps give us a magnified picture of a region or area of the Earth.
Answer
Topographical maps are large-scale maps. Since they are drawn on a large scale, a small area is shown in great detail, which gives us a magnified picture of a region or area of the Earth. This makes the detailed depiction of both natural and human-made features possible.
Give reason — A string is used to measure distance along a curved line.
Answer
A string is used because it can bend and follow a curved line, such as a river or footpath. It is then straightened and measured with a ruler, and the map scale is used to calculate the actual ground distance.
Give reason — Maps use a set of standard signs and symbols.
Answer
Maps use a set of standard signs and symbols that are internationally accepted to depict certain features and characteristics. These are known as conventional symbols. With the help of these symbols, it becomes very easy to read and understand a map.
Define the following terms:
a. conventional symbols
b. contour lines
c. grid lines
d. barren lands
e. sand dunes
Answer
a. Conventional symbols — A set of standard signs and symbols that are internationally accepted to depict certain features and characteristics on a map.
b. Contour lines — Lines on a map joining points that are at the same height above or below the sea level.
c. Grid lines — A set of red lines drawn on every topographical map. The lines drawn horizontally are called northings and the vertical lines are called eastings.
d. Barren lands — Dry lands where plants cannot grow. They are shown in white on topographical maps.
e. Sand dunes — Hills of sand formed by the wind in a desert or near a beach.
Look at the given picture and answer the following questions.
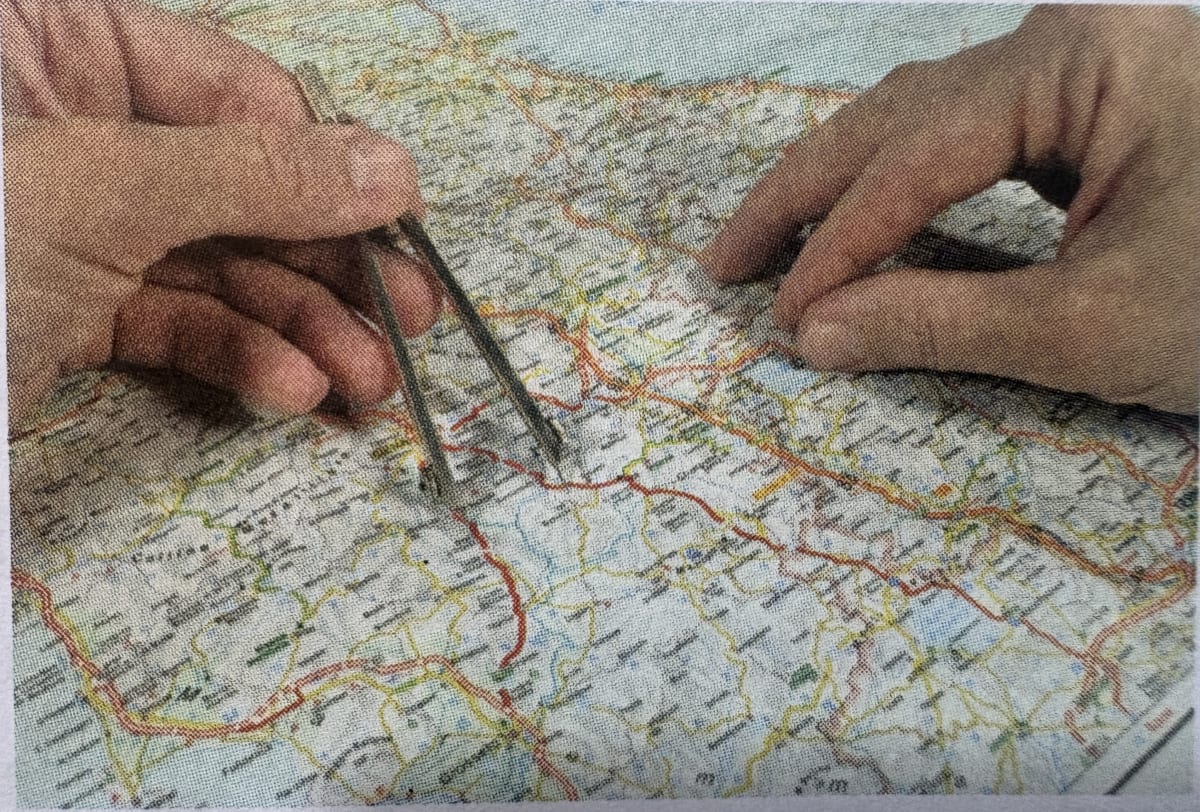
a. How is distance measured along the straight line?
b. If the scale of the given map is 1:100,000, calculate the actual distance on the ground.
Answer
a. To measure the distance along a straight line, we first measure it with a divider. The divider is then placed on the ruler to get the exact map distance in centimetres. Using the scale of the map, this map distance is converted into the actual ground distance in metres and kilometres.
b. In the worked example associated with this picture in the chapter, the map distance is 6.4 cm. A scale of 1:100,000 means that 1 cm on the map represents 100,000 cm, that is, 1 km on the ground.
Therefore, 6.4 cm on the map represents 6.4 km on the ground.
∴ The actual distance on the ground is 6.4 km (6 km 400 m).