
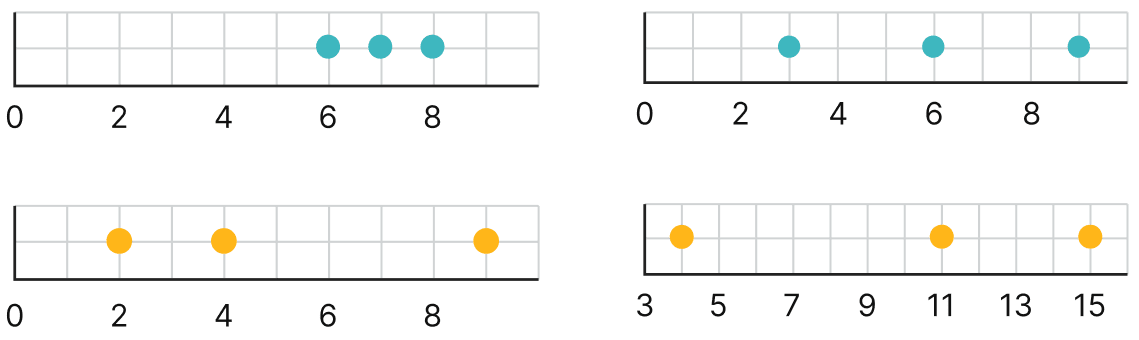
Calculate and mark the mean of each collection of data below.
Answer
For each collection,
Mean =
The mean of each collection is calculated below and then marked on the respective dot plot.
(i) The collection is 6, 7, 8.
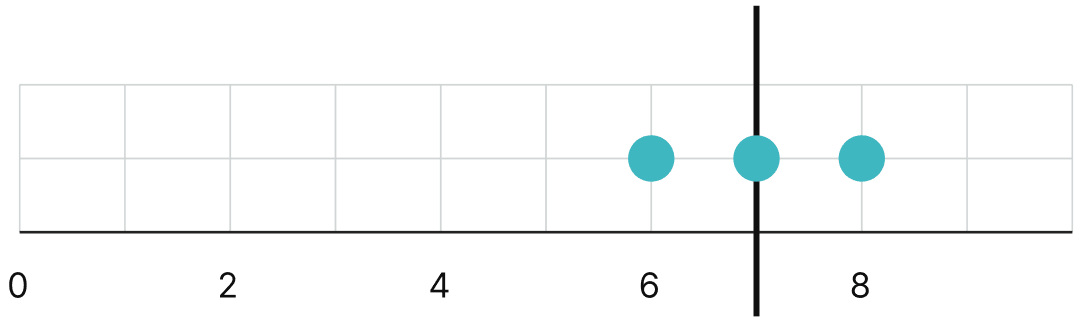
(ii) The collection is 3, 6, 9.
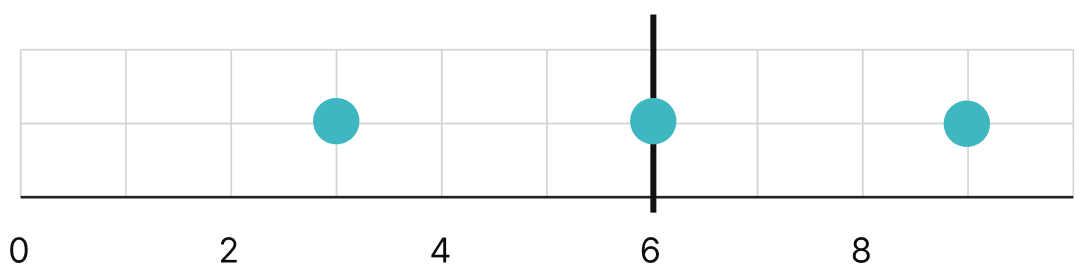
(iii) The collection is 2, 4, 9.
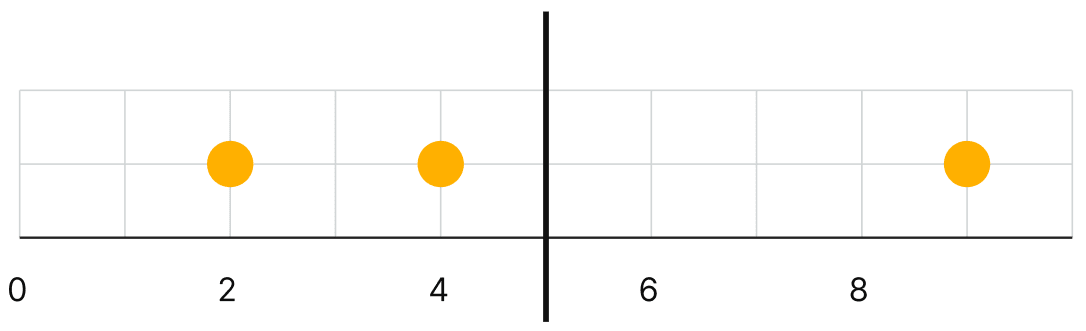
(iv) The collection is 4, 11, 15.
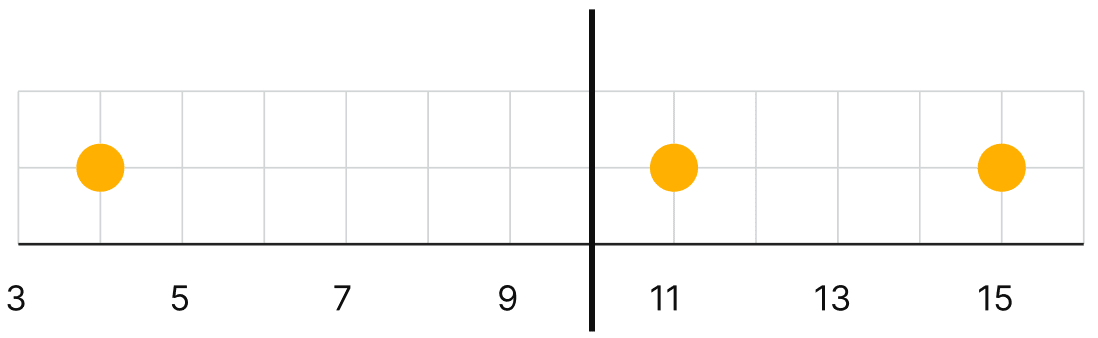
Hence, the means of the four collections are 7, 6, 5 and 10 respectively.
Can you explain how the mean is the centre of each collection?
Answer
The mean is the centre of a collection because the total of the distances from the mean to the values smaller than it is exactly equal to the total of the distances from the mean to the values greater than it. In other words, the data is balanced on either side of the mean.
For example, consider the collection 4, 11, 15 whose mean is 10.
⇒ Distance of the value less than the mean = 10 - 4 = 6
⇒ Total distance of the values greater than the mean = (11 - 10) + (15 - 10) = 1 + 5 = 6
∴ The total distance on the left of the mean equals the total distance on the right of the mean.
Hence, the mean acts as the centre, since the total distances on both sides of it are equal.
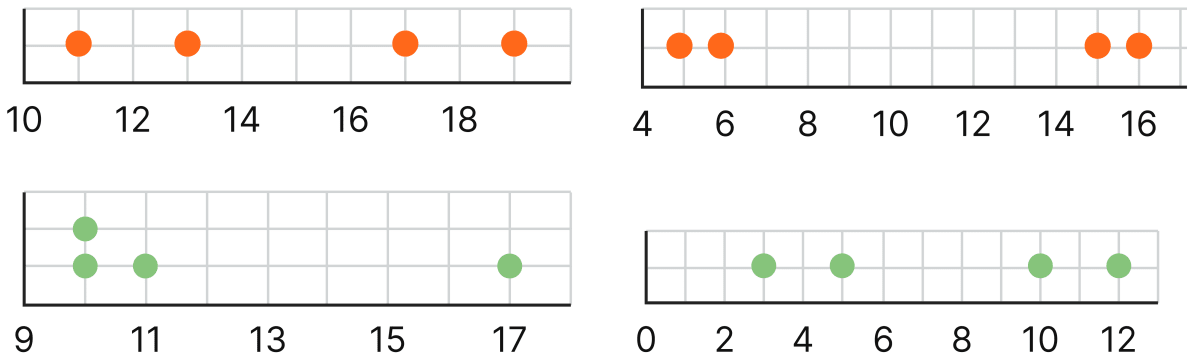
Mark the mean for the collections below.
Answer
For each collection,
Mean =
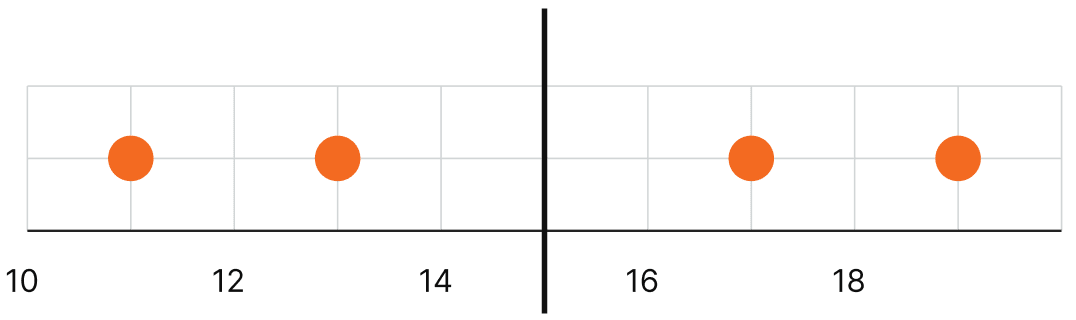
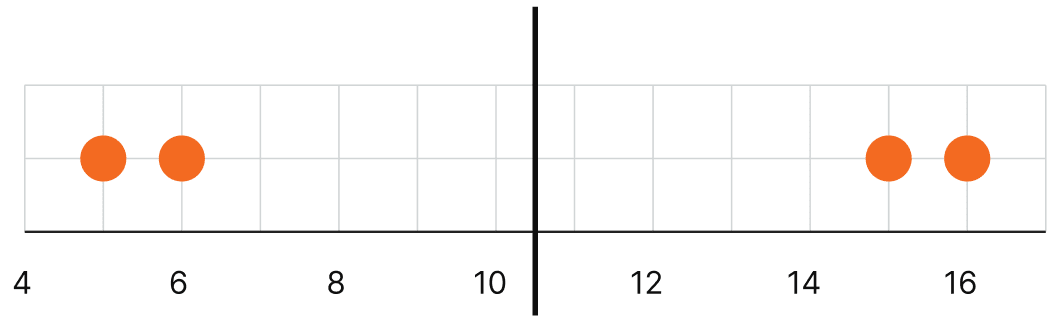
The mean of each collection is calculated below and then marked on the respective dot plot.
(i) The collection is 11, 13, 17, 19.
(ii) The collection is 5, 6, 15, 16.
(iii) The collection is 10, 10, 11, 17.
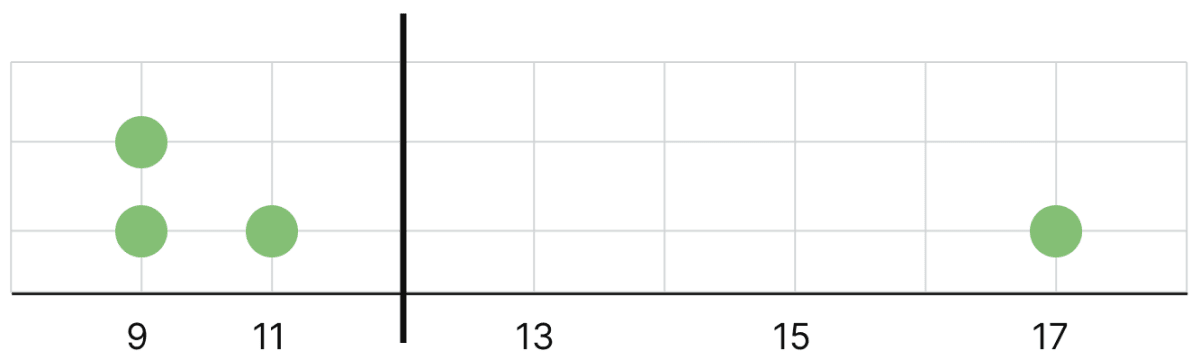
(iv) The collection is 3, 5, 10, 12.
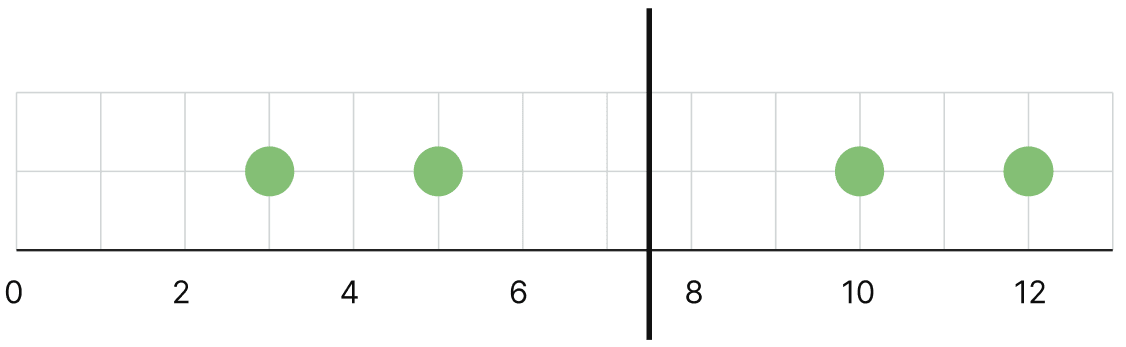
Hence, the means of the four collections are 15, 10.5, 12 and 7.5 respectively.
What happens to the mean when an existing value is removed? When will the mean increase, decrease, or stay the same?
Answer
When an existing value is removed from a collection, the mean changes to maintain the balance of the data.
(i) If a value greater than the mean is removed, the mean decreases.
(ii) If a value smaller than the mean is removed, the mean increases.
(iii) If a value equal to the mean is removed, the mean stays the same.
Hence, removing a value greater than the mean lowers it, removing a value smaller than the mean raises it, and removing a value equal to the mean leaves it unchanged.
What happens to the mean if a value equal to the mean is included or removed?
Answer
If a value equal to the mean is included or removed, the mean remains unchanged.
This can be explained using the fair-share interpretation of the mean. The mean represents the equal share each value would receive if the total were shared equally among all the values.
A value that is already equal to the mean has exactly its fair share. Therefore, adding such a value or removing it does not change the equal share of the remaining values.
Verification using algebra:
Let the mean of n values be a, so the sum of the values = n × a.
On including one more value equal to a :
∴ The mean remains a.
Hence, including or removing a value equal to the mean does not change the mean.
Explore if it is possible to include or remove 2 values such that the mean is unchanged.
Answer
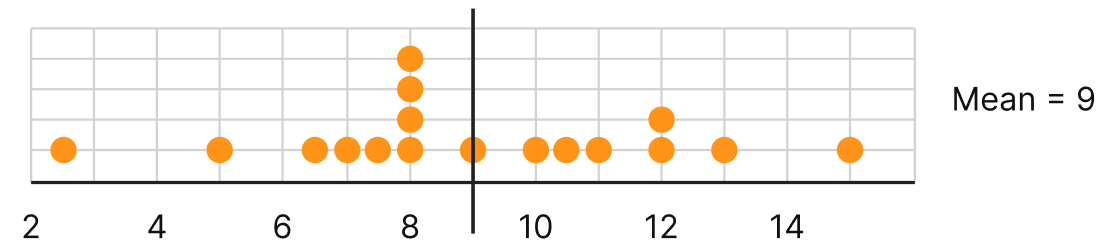
Yes, it is possible.
For the given data, the mean is 9.
If two values whose average is equal to the mean are included or removed, the mean remains unchanged.
For example, we can include 6 and 12.
Let the data have n values, so its sum is 9n.
On including 6 and 12,
∴ The mean remains 9.
Since the average of the two new values is equal to the mean of the collection, the mean does not change.
Hence, including or removing two values whose average is equal to the mean (such as 6 and 12) keeps the mean unchanged.
How about including or removing 3 values without changing the mean? Is it possible?
Answer
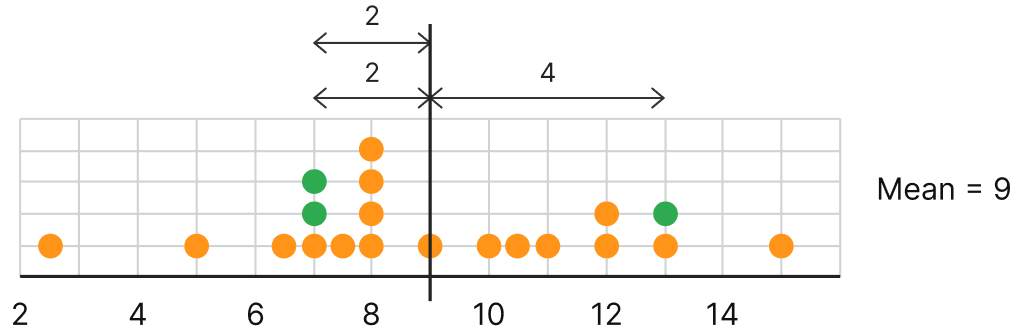
Yes, it is possible.
For the given data, the mean is 9.
If three values whose average is equal to the mean are included or removed, the mean remains unchanged.
For example, we can include 7, 8 and 12.
Let the data have n values, so its sum = 9n.
On including 7, 8 and 12:
∴ The mean remains 9.
Since the average of these three values is equal to the mean of the collection, the mean does not change.
Hence, including or removing three values whose average is equal to the mean (such as 7, 8 and 12) keeps the mean unchanged.
Can we include 2 values less than the mean and 1 value greater than the mean, so that the mean remains the same?
Answer
Yes, we can.
For the mean to remain the same, the total amount by which the two smaller values fall below the mean must equal the amount by which the larger value rises above the mean.
For the given data, the mean is 9. One such possibility (shown in the figure) is to include 7, 7 and 13.
⇒ Amount below the mean = (9 - 7) + (9 - 7) = 2 + 2 = 4
⇒ Amount above the mean = 13 - 9 = 4
Since these are equal, the balance is maintained.
We can also check the sum:
7 + 7 + 13 = 27 = 3 × 9
Let the data have n values, so its sum is 9n.
On including 7, 7 and 13,
∴ The mean remains 9.
Hence, including 2 values less than the mean and 1 value greater than the mean (such as 7, 7 and 13) keeps the mean unchanged.
Try to include 2 values greater than the mean and 1 value less than the mean, so that the mean stays the same.
Answer
Yes, this is possible.
For the mean to remain the same, the total amount by which the two larger values rise above the mean must equal the amount by which the smaller value falls below the mean.
For the given data, the mean is 9. One such possibility is to include 11, 11 and 5.
⇒ Amount above the mean = (11 - 9) + (11 - 9) = 2 + 2 = 4
⇒ Amount below the mean = 9 - 5 = 4
Since these are equal, the balance is maintained.
We can also check the sum:
11 + 11 + 5 = 27 = 3 × 9
Let the data have n values, so its sum is 9n.
On including 11, 11 and 5,
∴ The mean remains 9.
Hence, including 2 values greater than the mean and 1 value less than the mean (such as 11, 11 and 5) keeps the mean unchanged.
Consider the data: 8, 3, 10, 13, 4, 6, 7, 7, 8, 8, 5. Calculate its mean.
(i) Consider this data with every value increased by 10: 18, 13, 20, 23, 14, 16, 17, 17, 18, 18, 15. What is its mean? Is there a quicker way to find out?
Answer
Mean =
Hence, the mean of the data is .
(i)
Mean =
Yes, there is a quicker way.
This collection is obtained by adding 10 to every value of the earlier data:
8, 3, 10, 13, 4, 6, 7, 7, 8, 8, 5.
Since every value has increased by 10, the mean also increases by 10.
The mean of the earlier data is .
∴ New mean =
Hence, the mean of the new data is , which can be found simply by adding 10 to the previous mean.
Try to explain, using algebra, what the average is when a fixed number, e.g., 2 is subtracted from every value in the collection.
Answer
(i) Suppose there are n values in the collection. Let these values be represented by . Their average is given by —
When a fixed number, for example, 2, is subtracted from every value in the collection, the new average becomes
That is, the new average is 2 less than the previous average.
Hence, when a fixed number is subtracted from every value in the collection, the average also decreases by that same number.
Try to explain this using the fair-share interpretation of average that you learnt last year.
Answer
The average is the equal share that each value would get if the total of all the values were shared equally among them.
When a fixed number, such as 2, is subtracted from every value, the total of the collection decreases by 2 for each of the n values, that is, by 2n.
When this reduced total is shared equally among the same n values, each share decreases by
Therefore, the average becomes 2 less than before.
Hence, by the fair-share interpretation, subtracting a fixed number from every value decreases the average by the same number.
| 1 | Name | Odia (R1) | Telugu (R2) | English (R3) | Maths | Social | Science | Total |
|---|---|---|---|---|---|---|---|---|
| 2 | Ratna | 25 | 39 | 29 | 36 | 34 | 37 | |
| 3 | Nagesh | 41 | 43 | 48 | 39 | 40 | 39 | |
| 4 | Ashwin | 29 | 31 | 33 | 34 | 30 | 28 | |
| 5 | Farooq | 47 | 46 | 38 | 42 | 49 | 44 | |
| 6 | Mrinal | 33 | 35 | 28 | 32 | 30 | 36 | |
| 7 | Gowri | 27 | 29 | 34 | 31 | 32 | 30 | |
| 8 | Pankaj | 16 | 19 | 22 | 17 | 18 | 20 |
(i) Can you tell what data is in column B7?
(ii) In which subjects has Ashwin scored more than 30 marks?
(iii) What formula would you type to find out the class average marks in Science?
(iv) Find out if the class average marks in Odia is greater than the class average marks in Telugu.
(v) Show the average marks in other subjects after the last row by typing the appropriate formulae.
(vi) Get the total scores of each student by typing the appropriate formulae.
Answer
In the spreadsheet, the columns store the data as A → Name, B → Odia, C → Telugu, D → English, E → Maths, F → Social Science and G → Science. Row 1 holds the headings, so the 22 students’ marks occupy rows 2 to 23.
(i) The cell B7 lies in column B (Odia) and row 7 (Gowri). So it holds Gowri’s marks in Odia, which is 27.
Hence, the cell B7 contains Gowri’s Odia marks (27).
(ii) Ashwin’s marks are Odia 29, Telugu 31, English 33, Maths 34, Social Science 30 and Science 28. The marks more than 30 are in Telugu (31), English (33) and Maths (34).
∴ Ashwin has scored more than 30 marks in Telugu, English and Mathematics. (Social Science is exactly 30, so it is not included.)
(iii) The Science marks are in column G, in rows 2 to 23. So the formula is
=AVERAGE(G2:G23)
Hence, the class average in Science can be found using =AVERAGE(G2:G23).
(iv) The Odia marks are in column B and the Telugu marks are in column C, both in rows 2 to 23. The two averages are found using
=AVERAGE(B2:B23) and =AVERAGE(C2:C23)
⇒ Class average in Odia =
⇒ Class average in Telugu =
Hence, the class average in Odia (about 31.23) is not greater than the class average in Telugu (about 33.59).
(v) The average marks of each subject can be shown in the row just below the last student (row 24) by typing —
=AVERAGE(B2:B23), =AVERAGE(C2:C23), =AVERAGE(D2:D23), =AVERAGE(E2:E23), =AVERAGE(F2:F23), =AVERAGE(G2:G23)
in the cells B24, C24, D24, E24, F24 and G24 respectively.
Hence, the average marks for each subject can be obtained using the AVERAGE formula.
(vi) The total score of each student can be shown in a new column (say column H) by typing —
=SUM(B2:G2) in H2 for the first student, =SUM(B3:G3) in H3 for the next student, and so on up to =SUM(B23:G23) in H23 for the last student.
Hence, the total marks of each student can be obtained using the SUM formula.
Find the mean of the following data and share your observations:
(i) The first 50 natural numbers.
(ii) The first 50 odd numbers.
(iii) The first 50 multiples of 4.
Answer
For each collection,
Mean =
(i) The first 50 natural numbers are 1, 2, 3, …, 50.
The sum of the first n natural numbers is .
(ii) The first 50 odd numbers are 1, 3, 5, …, 99.
The sum of the first n odd numbers is n2.
(iii) The first 50 multiples of 4 are 4, 8, 12, …, 200.
Observation: In each case the numbers are equally spaced (they form an arithmetic progression). For such evenly spaced data, the mean is simply the average of the first and the last values, that is, the middle of the data.
⇒ (i)
⇒ (ii)
⇒ (iii)
Hence, the means are 25.5, 50 and 102 respectively.
The dot plot below shows a collection of data and its average; but one dot is missing. Mark the missing value so that the mean is 9 (as shown below).
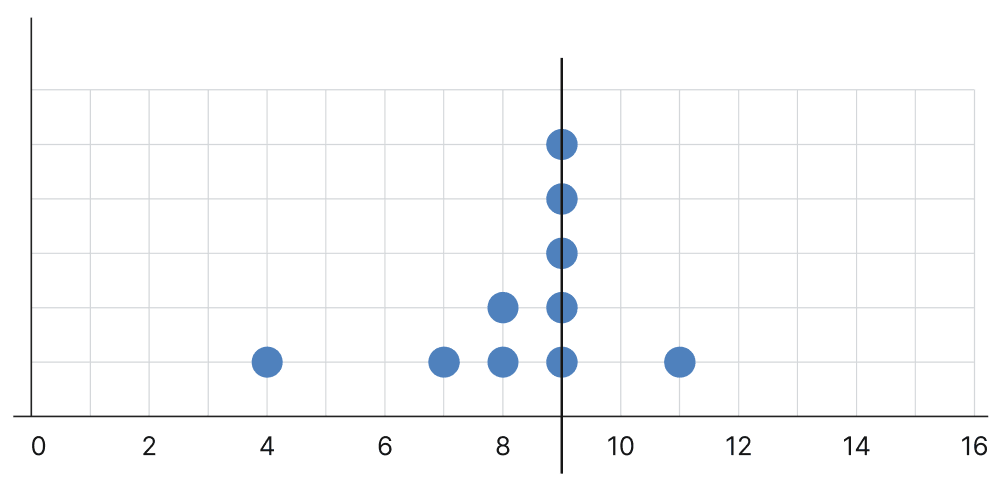
Answer
The dots shown on the plot are at 4, 7, 8, 8, 9, 9, 9, 9, 9 and 11. So 10 values are shown and one value is missing, making 11 values in all.
⇒ Sum of the shown values = 4 + 7 + 8 + 8 + 9 + 9 + 9 + 9 + 9 + 11 = 83
Let the missing value be x.
For the mean of all 11 values to be 9,
= 9
⇒ 83 + x = 9 × 11
⇒ 83 + x = 99
⇒ x = 99 − 83
⇒ x = 16
∴ The missing value is 16, so a dot should be marked at 16.
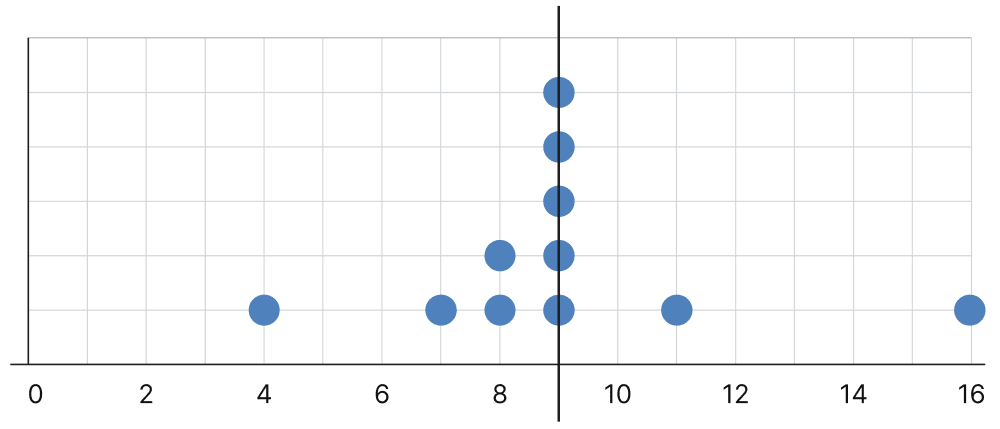
Hence, marking a dot at 16 makes the mean of the data equal to 9.
Sudhakar, the class teacher, asks Shreyas to measure the heights of all 24 students in his class and calculate the average height. Shreyas informs the teacher that the average height is 150.2 cm. Sudhakar discovers that the students were wearing uniform shoes when the measurements were taken and the shoes add 1 cm to the height.
(i) Should the teacher get all the heights measured again without the shoes to find the correct average height? Or is there a simpler way?
(ii) What is the correct average height of the class?
- 174.2 cm
- 126.2 cm
- 150.2 cm
- 149.2 cm
- 151.2 cm
- None of the above
- Insufficient information
Answer
(i) No, the teacher need not measure all the heights again. Since the shoes add 1 cm to the height of every student, the average height also increases by 1 cm. Therefore, the correct average can be found by subtracting 1 cm from the measured average.
Hence, there is no need to measure again.
(ii) Correct average height = Measured average − 1 cm
⇒ Correct average height = 150.2 − 1 = 149.2 cm
∴ The correct average height of the class is 149.2 cm, which is option 4.
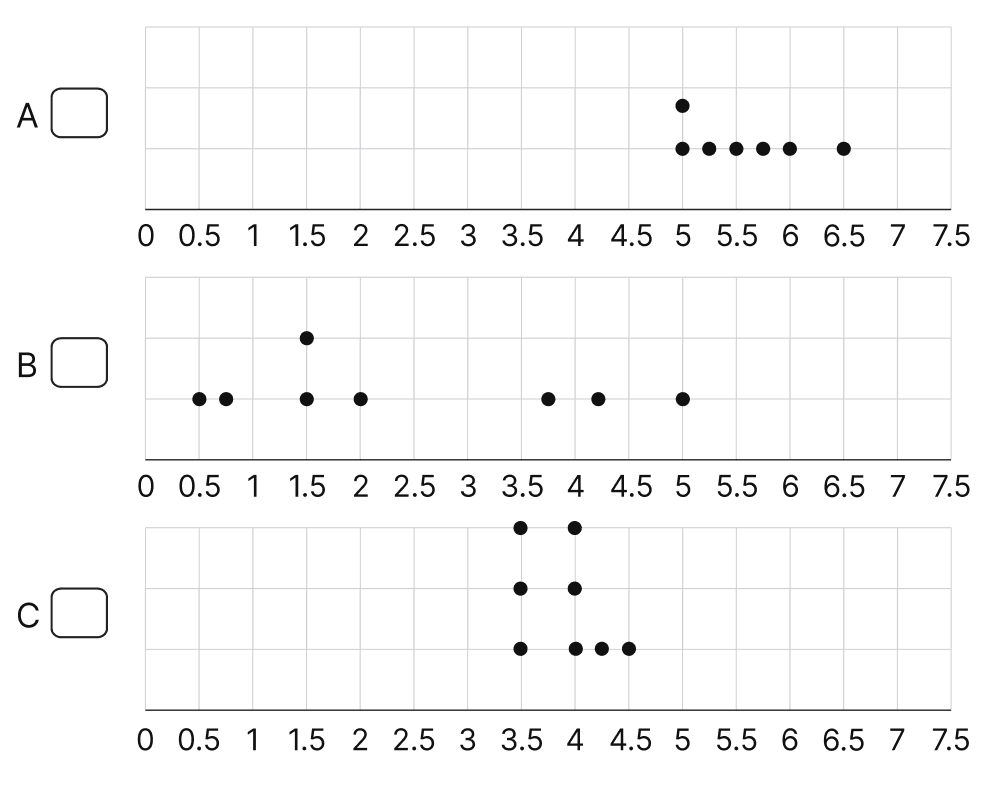
The three dot plots below show the lengths, in minutes, of songs of different albums. Which of these has a mean of 5.57 minutes? Explain how you arrived at the answer.
Answer
The mean of each dot plot is found by reading off the values from the plot and dividing their sum by the number of values.
Plot A: The values are 5, 5, 5.25, 5.5, 5.75, 6 and 6.5 (7 values).
Plot B: The values are 0.5, 0.75, 1.5, 1.5, 2, 3.75, 4.25 and 5 (8 values).
Plot C: The values are 3.5, 3.5, 3.5, 4, 4, 4, 4.25 and 4.5 (8 values).
Only Plot A gives a mean of about 5.57 minutes.
∴ Plot A is the album whose songs have a mean length of 5.57 minutes.
Hence, Plot A is the album whose songs have a mean length of 5.57 minutes.
Find the median of 8, 10, 19, 23, 26, 34, 40, 41, 41, 48, 51, 55, 70, 84, 91, 92.
(i) If we include one value to the data (in the given list) without affecting the median, what could that value be?
(ii) If we include two values to the data without affecting the median what could the two values be?
(iii) If we remove one value from the data without affecting the median what could the value be?
Answer
The data is already arranged in increasing order and has 16 values (an even number). So the median is the average of the 8th and 9th values.
The 8th value is 41 and the 9th value is 41.
The two middle values are both 41, which is what makes the median very stable.
(i) After including one value, there will be 17 values, and the median will be the 9th value.
Since the middle values are both 41, any value may be included without changing the median.
Hence, the median is 41; any single value can be included or removed without changing it.
(ii) After including two values, there will be 18 values, and the median will be the average of the 9th and 10th values.
To keep the median equal to 41, one included value should be less than or equal to 41, and the other should be greater than or equal to 41.
For example, 30 and 50, or 41 and 41.
Two values can be included without changing the median provided one is less than or equal to 41 and the other is greater than or equal to 41.
(iii) After removing one value, there will be 15 values, and the median will be the 8th value.
Since the two middle values are both 41, any value may be removed without changing the median.
∴ Any value may be removed — the median remains 41.
Examine the statements below and justify if the statement is always true, sometimes true, or never true.
(i) Removing a value less than the median will decrease the median.
(ii) Including a value less than the mean will decrease the mean.
(iii) Including any 4 values will not affect the median.
(iv) Including 4 values less than the median will increase the median.
Answer
We examine each statement separately.
(i) Removing a value less than the median will decrease the median.
This statement is never true.
Removing a value smaller than the median shifts the middle of the data towards the larger values. Hence, the median either remains the same or increases, but it does not decrease.
For example, consider the data 1, 2, 3, 4, 5, whose median is 3. Removing the value 1 (which is less than the median) gives 2, 3, 4, 5.
⇒ New median =
The median increases from 3 to 3.5.
∴ Removing a value less than the median never decreases the median.
(ii) Including a value less than the mean will decrease the mean.
This statement is always true.
Let the data have n values with mean a. Then the sum of the values is na.
Suppose a value v, where v < a, is included.
Since v < a, we have na + v < na + a = a(n + 1).
⇒
Thus, the new mean is less than the original mean.
∴ Including a value less than the mean always decreases the mean.
(iii) Including any 4 values will not affect the median.
This statement is sometimes true.
Whether the median changes depends on which 4 values are included.
For the data 10, 20, 30, 40, 50, whose median is 30:
⇒ Including 29, 30, 31 and 32 gives 10, 20, 29, 30, 30, 31, 32, 40, 50, whose median is still 30 (unchanged).
⇒ Including 60, 70, 80 and 90 gives 10, 20, 30, 40, 50, 60, 70, 80, 90, whose median is 50 (changed).
∴ Including four values may or may not change the median.
(iv) Including 4 values less than the median will increase the median.
This statement is never true.
Including four values that are all less than the median adds more values to the lower side of the data. Hence, the median either remains the same or decreases, but it cannot increase.
For example, consider the data 10, 20, 30, 40, 50, whose median is 30.
Including 5, 6, 7 and 8 (all less than 30) gives
5, 6, 7, 8, 10, 20, 30, 40, 50.
⇒ New median = 10
Thus, the median decreases from 30 to 10.
∴ Including four values less than the median never increases the median.
Hence, statement (i) is never true, statement (ii) is always true, statement (iii) is sometimes true, and statement (iv) is never true.
The mean of the numbers 8, 13, 10, 4, 5, 20, y, 10 is 10.375. Find the value of y.
Answer
There are 8 numbers, and their mean is 10.375.
Mean =
Hence, the value of y is 13.
The mean of a set of data with 15 values is 134. Find the sum of the data.
Answer
Mean =
⇒ Sum of all observations = Mean × Number of all observations
⇒ Sum of all observations = 134 × 15
⇒ Sum of all observations = 2010
Hence, the sum of the data is 2010.
Consider the data: 12, 47, 8, 73, 18, 35, 39, 8, 29, 25, p. Which of the following number(s) could be p if the median of this data is 29?
- 10
- 25
- 40
- 100
- 29
- 47
- 30
Answer
Including p, there are 11 values in the data. For 11 values, the median is the 6th value when the data is arranged in ascending order.
Arranging the 10 given values in ascending order:
8, 8, 12, 18, 25, 29, 35, 39, 47, 73
There are already 5 values less than 29.
Therefore, for 29 to remain the 6th value, p must be 29 or greater than 29.
We now check each option:
⇒ p = 10: less than 29, so the 6th value becomes 25. Median = 25. ✗
⇒ p = 25: less than 29, so the 6th value becomes 25. Median = 25. ✗
⇒ p = 40: greater than 29, so the 6th value remains 29. Median = 29. ✓
⇒ p = 100: greater than 29, so the 6th value remains 29. Median = 29. ✓
⇒ p = 29: the 6th value is 29. Median = 29. ✓
⇒ p = 47: greater than 29, so the 6th value remains 29. Median = 29. ✓
⇒ p = 30: greater than 29, so the 6th value remains 29. Median = 29. ✓
Hence, p could be 29, 30, 40, 47, or 100.
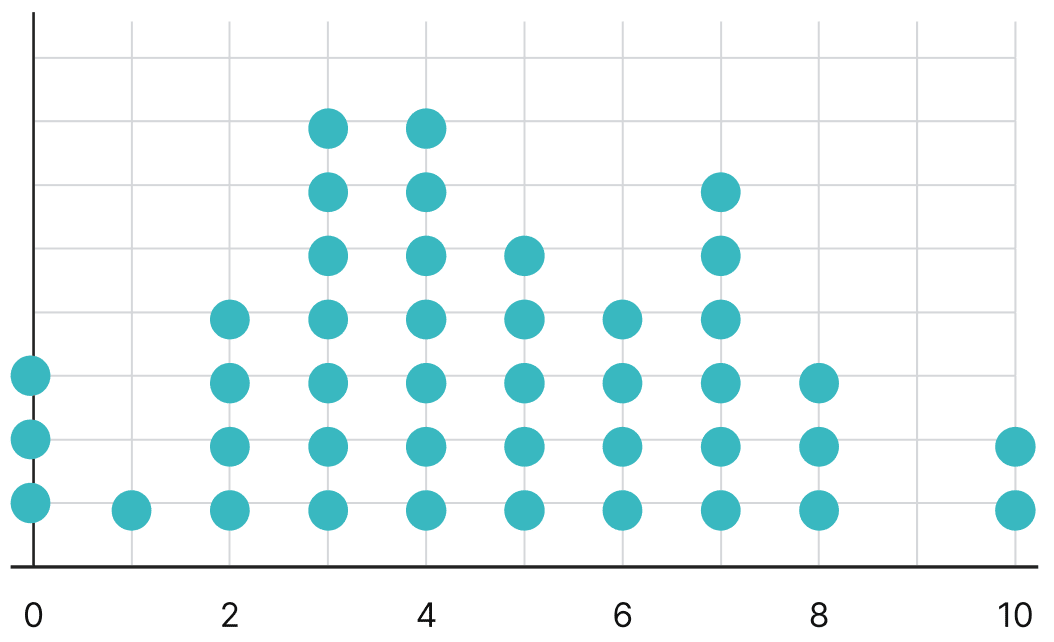
The number of times students rode their cycles in a week is shown in the dot plot below. Four students rode their cycles twice in that week.
(i) Find the average number of times students rode their cycles.
(ii) Find the median number of times students rode their cycles.
(iii) Which of the following statements are valid? Why?
- Everyone used their cycle at least once.
- Almost everyone used their cycle a few times.
- There are some students who cycled more than once on some days.
- Exactly 5 students have used their cycles more than once on some days.
- The following week, if all of them cycled 1 more time than they did the previous week, what would be the average and median of the next week's data?
Answer
Reading the dot plot, the number of students for each value (number of times cycled) is as follows:
| Number of times | 0 | 1 | 2 | 3 | 4 | 5 | 6 | 7 | 8 | 9 | 10 |
|---|---|---|---|---|---|---|---|---|---|---|---|
| Number of students | 3 | 1 | 4 | 7 | 7 | 5 | 4 | 6 | 3 | 0 | 2 |
(The value 2 has 4 students, which matches the given information that four students rode their cycles twice.)
⇒ Total number of students = 3 + 1 + 4 + 7 + 7 + 5 + 4 + 6 + 3 + 0 + 2 = 42
(i) Average number of times students rode their cycles:
Mean = [(0 × 3) + (1 × 1) + (2 × 4) + (3 × 7) + (4 × 7) + (5 × 5) + (6 × 4) + (7 × 6) + (8 × 3) + (9 × 0) + (10 × 2)] / 42
= [0 + 1 + 8 + 21 + 28 + 25 + 24 + 42 + 24 + 0 + 20]/42
= 193/42
≈ 4.6
∴ The average number of times students rode their cycles is about 4.6.
(ii) Median number of times students rode their cycles:
There are 42 values, so the median is the average of the 21st and 22nd values when the data is arranged in order.
| Value | Cumulative frequency |
|---|---|
| 0 | 3 |
| 1 | 4 |
| 2 | 8 |
| 3 | 15 |
| 4 | 22 |
| 5 | 27 |
| 6 | 31 |
| 7 | 37 |
| 8 | 40 |
| 9 | 40 |
| 10 | 42 |
⇒ The 21st and 22nd observations are both 4.
⇒ Median =
∴ The median number of times students rode their cycles is 4.
(iii) Examining each statement:
1. Everyone used their cycle at least once — Not valid.
There are 3 students at 0, so they did not ride their cycles during the week.
2. Almost everyone used their cycle a few times — Valid.
Out of 42 students, only 3 did not ride at all and 1 rode just once; the remaining 38 rode a few times. So almost everyone used their cycle a few times.
3. There are some students who cycled more than once on some days — Valid.
A week has 7 days. Students who rode 8 or 10 times must have ridden more than once on at least one day.
There are
- 3 students who rode 8 times,
- 2 students who rode 10 times.
So at least 5 students must have cycled more than once on some day.
4. Exactly 5 students have used their cycles more than once on some days — Not valid.
We can only be sure that the 5 students who rode more than 7 times definitely cycled more than once on some day. Students who rode 7 or fewer times in the week might also have cycled more than once on some day, so we cannot claim the number is exactly 5 — it is at least 5.
5. If every student cycles 1 more time the next week, then every value increases by 1. When the same number is added to every value, both the mean and the median increase by that number.
⇒ New average =
⇒ New median = 4 + 1 = 5
∴ The next week's average would be about 5.6 and the median would be 5.
Hence, the average is about 4.6, the median is 4, statements 2 and 3 are valid while statements 1 and 4 are not, and after each student cycles once more the average becomes about 5.6 and the median becomes 5.
A dart-throwing competition was organised in a school. The number of throws participants took to hit the bull's eye (the centre circle) is given in the table below. Describe the data using its minimum, maximum, mean and median.

| No. of trials | 1 | 2 | 3 | 4 | 5 | 6 | 7 | 8 | 9 | 10 |
|---|---|---|---|---|---|---|---|---|---|---|
| No. of students | 1 | 0 | 0 | 1 | 4 | 9 | 12 | 15 | 10 | 10 |
Answer
⇒ Total number of students = 1 + 0 + 0 + 1 + 4 + 9 + 12 + 15 + 10 + 10 = 62
Minimum: The smallest number of trials taken is 1 (by one student).
Maximum: The largest number of trials taken is 10.
Mean:
Mean = [(1 × 1) + (4 × 1) + (5 × 4) + (6 × 9) + (7 × 12) + (8 × 15) + (9 × 10) + (10 × 10)]/62
= [1 + 4 + 20 + 54 + 84 + 120 + 90 + 100]/62
= 473/62
≈ 7.6
∴ The mean number of trials is about 7.6.
Median:
There are 62 values, so the median is the average of the 31st and 32nd values when the data is arranged in order.
Adding the frequencies in order: 1, 1, 1, 2, 6, 15, 27 (up to 7 trials), 42 (up to 8 trials).
⇒ Both the 31st and 32nd values fall at 8 trials.
⇒ Median =
∴ The median number of trials is 8.
Describing the data: The number of trials ranges from a minimum of 1 to a maximum of 10. The mean (about 7.6) and the median (8) are close to each other and lie towards the higher end. This shows that most participants needed a fairly large number of trials (mainly 6 to 10) to hit the bull's eye, while very few managed it in the first few trials.
Hence, the data has a minimum of 1, a maximum of 10, a mean of about 7.6 and a median of 8, indicating that most participants took several trials to hit the bull's eye.
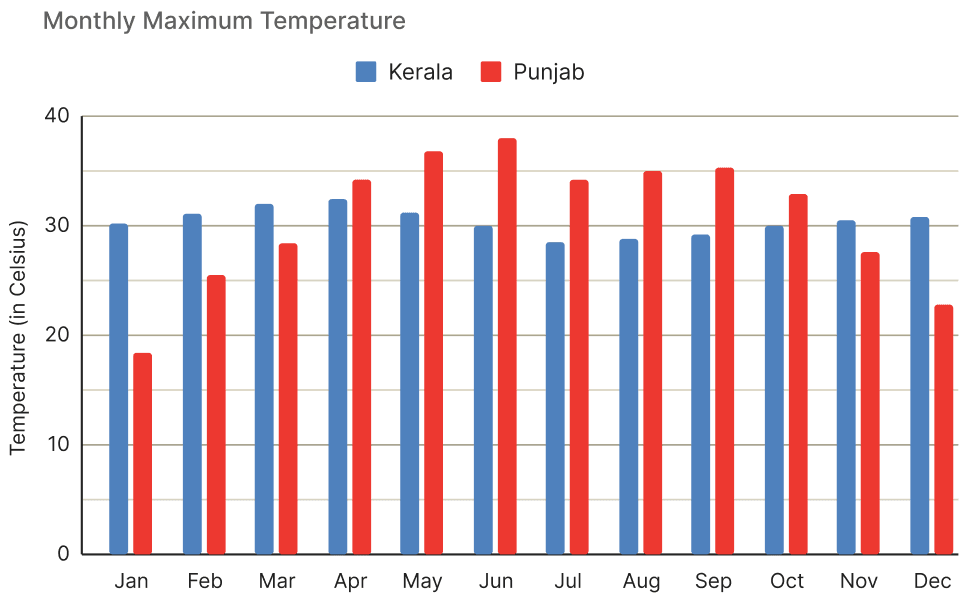
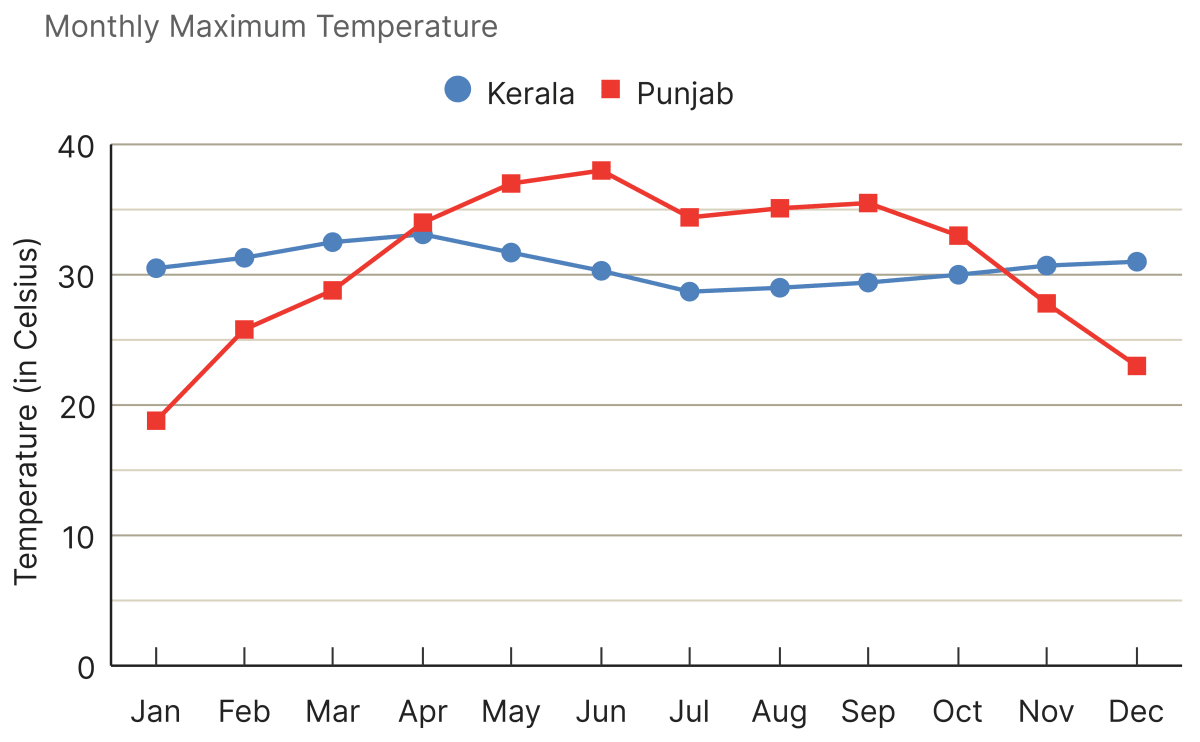
Observe the following graph. Do both these graphs represent the same information?
Answer
Yes, both graphs represent the same information — the monthly maximum temperatures of Kerala and Punjab in 2023.
The first graph is a clustered-column (bar) graph and the second is a line graph; only the way of presenting the data is different. In the line graph, the data points for each month are joined by lines, which makes it easier to see how the temperature changes over the course of the year.
Hence, both graphs show the same data, but presented in two different ways — as a clustered-column graph and as a line graph.
What could be the possible method used to derive this data? Discuss.
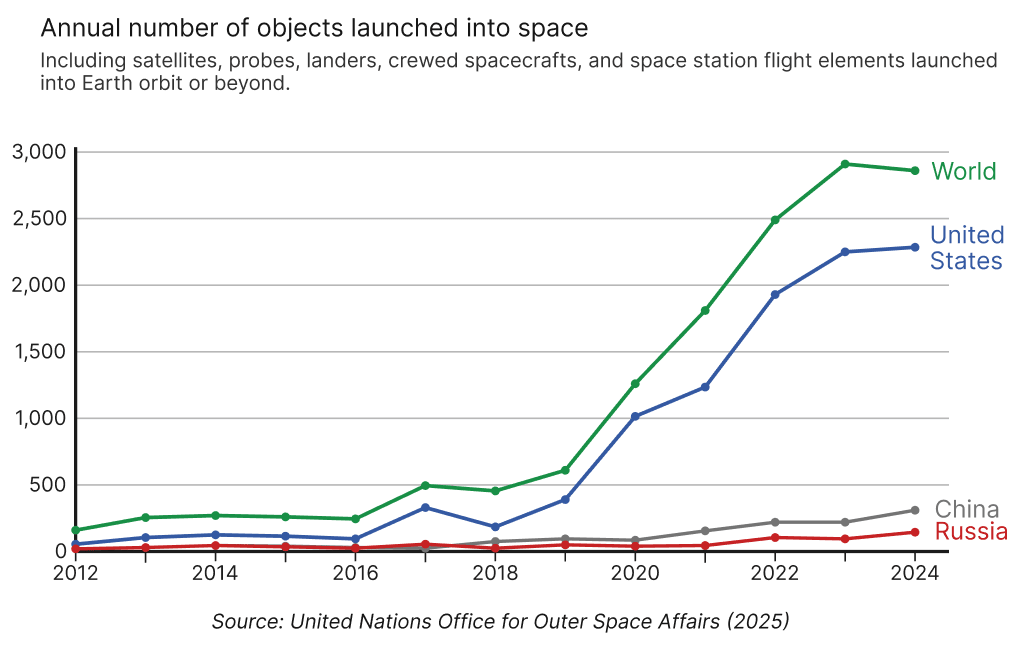
(i) Which of the following statements are valid inferences?
- From 2012 till 2024, the worldwide count of space object launches increased every year.
- USA is a major contributor in the years 2022 – 24, launching about th of the worldwide count.
- Nepal did not launch any object in the period 2012 – 24.
- The combined count of object launches by China and Russia in 2024 is about 400.
(ii) Identify two consecutive years where the worldwide count increased by 2 times or more.
Answer
The data could be obtained by recording every object — such as satellites, probes and other spacecraft — that is launched into space each year.
Space agencies and international bodies (the source given is the United Nations Office for Outer Space Affairs) maintain official registers of all space launches. By counting the number of launches in each year, both worldwide and for individual countries, the yearly counts shown in the graph can be compiled.
Hence, the data is most likely derived by counting and compiling the recorded launches of space objects each year from official launch registers maintained worldwide and by individual countries.
(i) We examine each statement.
⇒ From 2012 till 2024, the worldwide count increased every year — Not a valid inference.
The worldwide count fell from about 2900 in 2023 to about 2800 in 2024, so it did not increase every year.
⇒ USA launched about th of the worldwide count in 2022 – 24 — Valid.
In these years the USA's counts (about 1950, 2250 and 2280) are close to three-fourths of the worldwide counts (about 2500, 2900 and 2850).
⇒ Nepal did not launch any object in 2012 – 24 — Not a valid inference.
The graph shows only the World, the USA, China and Russia. It contains no data about Nepal, so nothing can be concluded about Nepal from this graph.
⇒ The combined count of China and Russia in 2024 is about 400 — Valid.
In 2024, China launched about 300 objects and Russia about 130, giving a combined total of roughly 400.
∴ Only the second and fourth statements are valid inferences.
(ii) Looking at the worldwide (green) line, the count rose from about 600 in 2019 to about 1300 in 2020.
⇒ , which is more than 2 times.
∴ Between 2019 and 2020, the worldwide count increased by 2 times or more.
Hence, the valid inferences are that the USA launched about three-fourths of the worldwide count in 2022 – 24 and that China and Russia together launched about 400 objects in 2024; and the worldwide count more than doubled from 2019 to 2020.
The average number of customers visiting a shop and the average number of customers actually purchasing items over different days of the week is shown in the table below. Visualise this data on a line graph.
| Mon | Tue | Wed | Thu | Fri | Sat | Sun | |
|---|---|---|---|---|---|---|---|
| Visiting | 16 | 19 | 10 | 14 | 20 | 22 | 35 |
| Purchasing | 10 | 8 | 7 | 11 | 12 | 16 | 26 |
Answer
Draw a line graph by taking the days of the week (Mon to Sun) along the horizontal axis and the number of customers along the vertical axis. Plot the points for each day and join consecutive points with line segments to form two lines — one for the customers visiting and one for the customers purchasing.
Plot the points:
⇒ Visiting: (Mon, 16), (Tue, 19), (Wed, 10), (Thu, 14), (Fri, 20), (Sat, 22), (Sun, 35)
⇒ Purchasing: (Mon, 10), (Tue, 8), (Wed, 7), (Thu, 11), (Fri, 12), (Sat, 16), (Sun, 26)
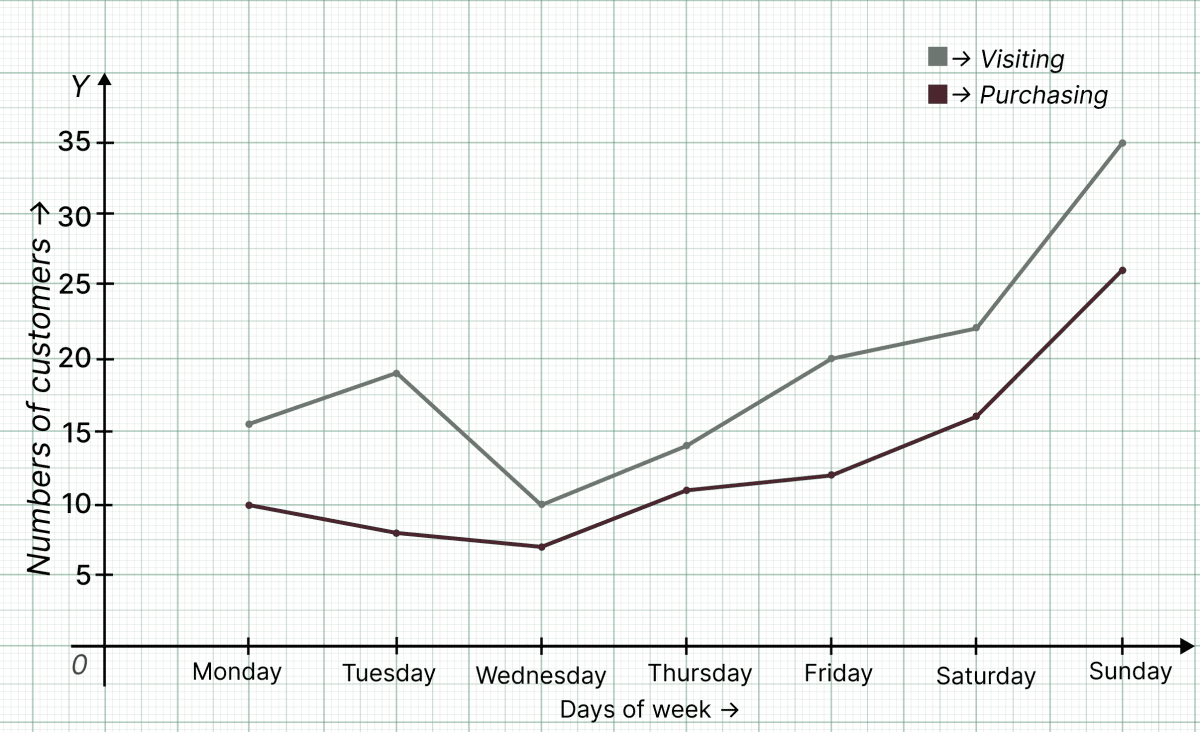
A few observations from the line graph:
(i) The number of customers visiting is greater than the number purchasing on every day of the week.
(ii) Both lines rise towards the weekend and reach their highest value on Sunday (35 visiting and 26 purchasing).
(iii) The gap between the two lines is widest on Tuesday, showing that the most visitors as well as the most purchases happen on Tuesday.
Hence, plotting both sets of values as separate lines against the days of the week gives the required line graph.
The average number of days of rainfall in each month for a few cities is shown in the table below:
| Jan | Feb | Mar | Apr | May | Jun | Jul | Aug | Sep | Oct | Nov | Dec | |
|---|---|---|---|---|---|---|---|---|---|---|---|---|
| Mangaluru | 0.1 | 0 | 0.1 | 1.8 | 6.2 | 24.1 | 27.7 | 24.5 | 14 | 8.8 | 3.9 | 0.9 |
| New Delhi | ||||||||||||
| Port Blair | 2.4 | 1.3 | 0.9 | 3.3 | 15.5 | 18.7 | 17.3 | 18.8 | 16.8 | 14.1 | 11.3 | 5.4 |
| Rameswaram | 2.6 | 1.3 | 1.9 | 3.4 | 2.5 | 0.4 | 1 | 1 | 1.9 | 8.1 | 10.4 | 7.8 |
(i) What could be the possible method to compile this data?
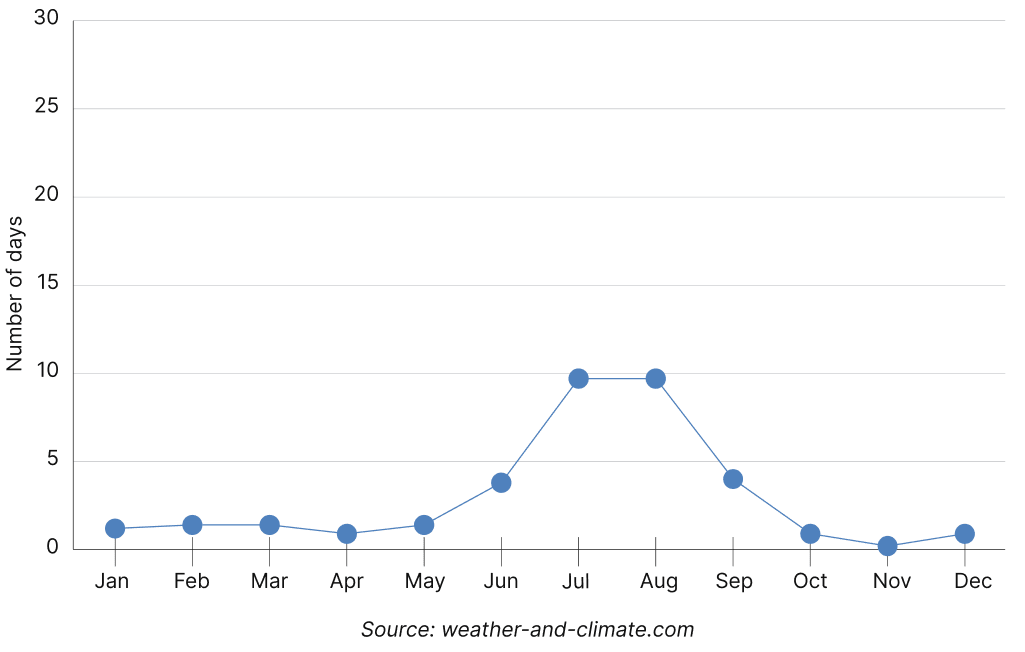
(ii) Mark the data for Mangaluru, Port Blair, and Rameswaram in the line graph shown below. You can round off the values to the nearest integer.
(iii) Based on the line for New Delhi in the graph fill the data in the table.
(iv) Which city among these receives the most number of days of rainfall per year? Which city gets the least number of days of rainfall per year?
(v) Looking at the table, when is the rainy season in New Delhi and Rameswaram?
Answer
(i) This data is the average number of rainy days in a month. It can be compiled by recording, at the weather stations of each city, on how many days it rained in a given month. This is done over several years, and for each month the counts are averaged across the years. For example, the number of rainy days in June is noted for many years and the average of these gives the average number of rainy days in June for that city.
(ii) Rounding each value to the nearest integer, the data to be marked is:
| Jan | Feb | Mar | Apr | May | Jun | Jul | Aug | Sep | Oct | Nov | Dec | |
|---|---|---|---|---|---|---|---|---|---|---|---|---|
| Mangaluru | 0 | 0 | 0 | 2 | 6 | 24 | 28 | 25 | 14 | 9 | 4 | 1 |
| Port Blair | 2 | 1 | 1 | 3 | 16 | 19 | 17 | 19 | 17 | 14 | 11 | 5 |
| Rameswaram | 3 | 1 | 2 | 3 | 3 | 0 | 1 | 1 | 2 | 8 | 10 | 8 |
Each city's values are marked as points and joined by line segments to get three lines on the graph.
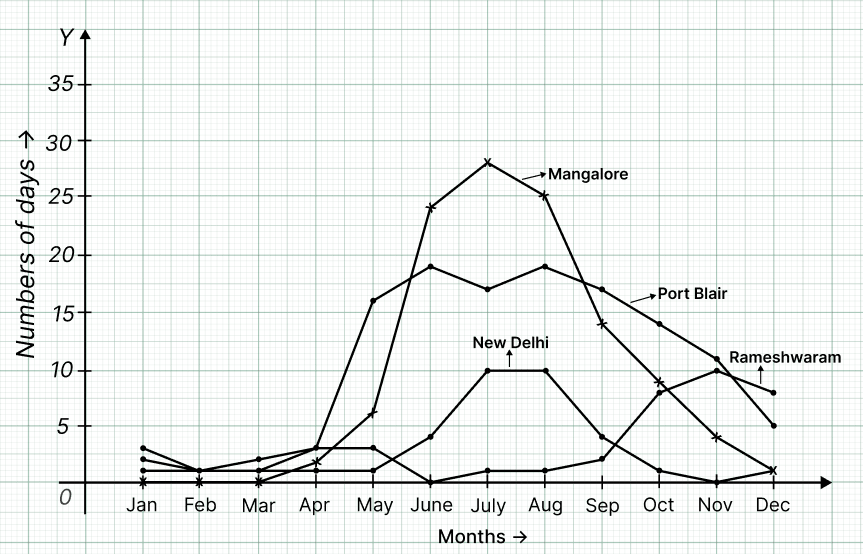
(iii) Reading the values of the New Delhi line from the graph (rounded to the nearest integer):
| Jan | Feb | Mar | Apr | May | Jun | Jul | Aug | Sep | Oct | Nov | Dec | |
|---|---|---|---|---|---|---|---|---|---|---|---|---|
| New Delhi | 1 | 1 | 1 | 1 | 1 | 4 | 10 | 10 | 4 | 1 | 0 | 1 |
(iv) Adding up the rainy days for each city over the whole year:
⇒ Mangaluru = 0.1 + 0 + 0.1 + 1.8 + 6.2 + 24.1 + 27.7 + 24.5 + 14 + 8.8 + 3.9 + 0.9 = 112.1 days
⇒ Port Blair = 2.4 + 1.3 + 0.9 + 3.3 + 15.5 + 18.7 + 17.3 + 18.8 + 16.8 + 14.1 + 11.3 + 5.4 = 125.8 days
⇒ Rameswaram = 2.6 + 1.3 + 1.9 + 3.4 + 2.5 + 0.4 + 1 + 1 + 1.9 + 8.1 + 10.4 + 7.8 = 42.3 days
⇒ New Delhi = 1 + 1 + 1 + 1 + 1 + 4 + 10 + 10 + 4 + 1 + 0 + 1 = 35 days
∴ Port Blair has the highest total (about 126 days) and New Delhi has the lowest total (about 35 days).
Hence, Port Blair receives the most days of rainfall per year and New Delhi receives the least days of rainfall per year.
(v) Looking at the months with the most rainy days:
⇒ New Delhi has its rainy days mostly in June – September, peaking in July and August (10 days each). This is the period of the south-west monsoon.
⇒ Rameswaram has its rainy days mostly in October – December, peaking in November (about 10 days). This is the period of the north-east monsoon.
Hence, the rainy season is around June – September (peaking in July – August) for New Delhi and around October – December (peaking in November) for Rameswaram.
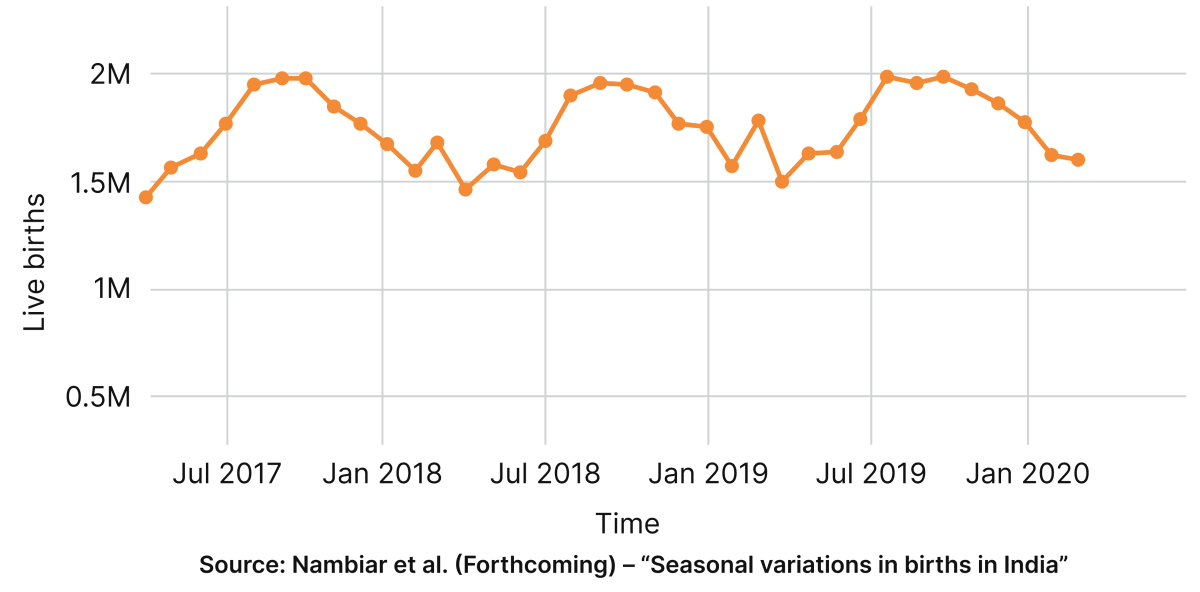
The following line graph shows the number of births in every month in India over a time period:
(i) What are your observations?
(ii) What was the approximate number of births in July 2017?
(iii) What time period does the graph capture?
(iv) Compare the number of births in the month of January in the years 2018, 2019, and 2020.
(v) Estimate the number of births in the year 2019.
Answer
(i) The graph shows a repeating (seasonal) pattern. The number of births rises and falls in a similar way each year. The highest values are close to 2 million, while the lowest values are around 1.4–1.5 million births.
(ii) The point for July 2017 lies a little below the yearly peak, at approximately 1.8 million births.
(iii) The horizontal axis runs from a little before July 2017 to a little after January 2020. So the graph captures roughly early 2017 to early 2020 — about 3 years.
(iv) January is a low point in each year. The number of births in January 2018, January 2019, and January 2020 are all roughly 1.5 – 1.7 million, so they are nearly the same (comparable) in all three years.
(v) The monthly number of births in 2019 varies between about 1.45 million and 1.9 million, with an average of roughly 1.7 million per month.
⇒ Births in 2019 ≈ 1.7 million × 12 = 20.4 million
∴ About 20 million births occurred in 2019 (approximately).
Hence, births in India follow a yearly seasonal pattern, with about 1.7 million births in July 2017 and roughly 20 million births in the whole of 2019.
Share your observations. Based on this infographic, answer the following:
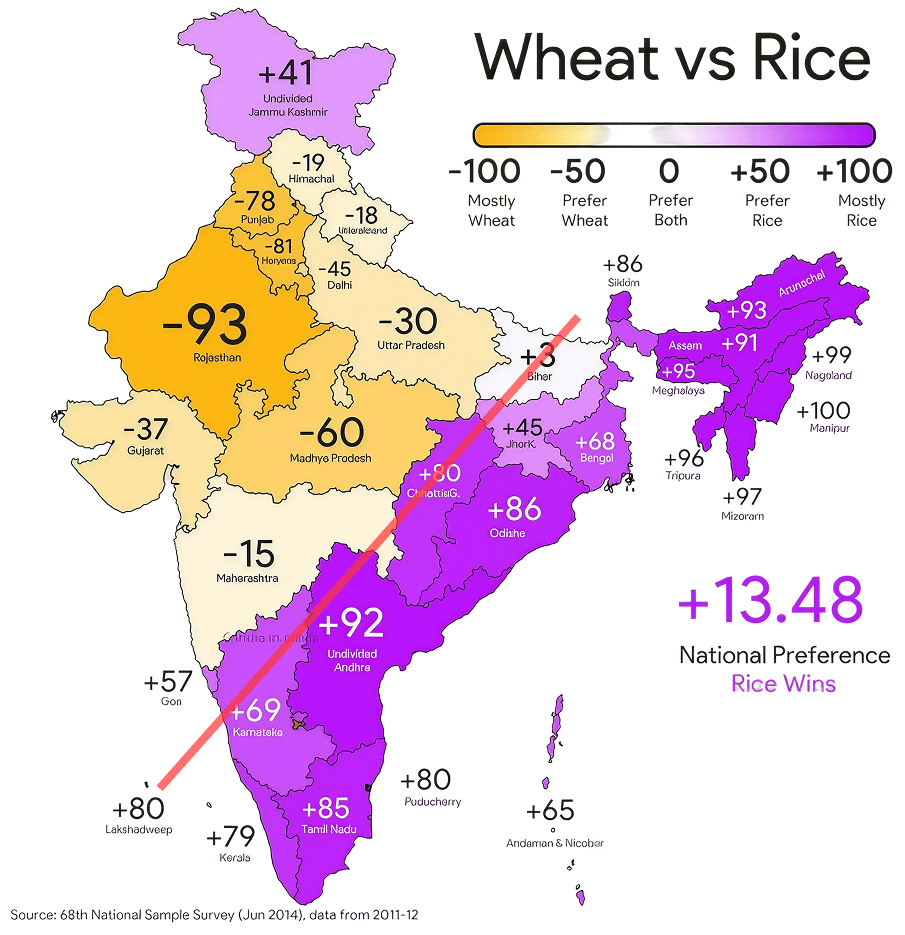
(i) The value of Karnataka is hidden. Can you guess what it could be?
(ii) Which are the top 5 states where rice is the most popular?
(iii) Which are the top 5 states where wheat is the most popular?
(iv) List a few states where the preference between rice and wheat is more or less balanced.
Answer
The infographic shows the preference for rice and wheat in different states. A value close to +100 means a strong preference for rice, a value close to −100 means a strong preference for wheat, and a value close to 0 means the preference is nearly balanced.
(i) Karnataka is surrounded by states that have positive values and prefer rice. Therefore, Karnataka is also likely to have a positive value. A reasonable estimate is about +70 (or between +60 and +80).
(ii) Top five rice-preferring states:
Manipur (+100)
Nagaland (+99)
Mizoram (+97)
Tripura (+96)
Meghalaya (+95)
(iii) Top five wheat-preferring states:
Rajasthan (−93)
Haryana (−81)
Punjab (−78)
Madhya Pradesh (−60)
Delhi (−45)
(iv) The states whose value is closest to 0 have a more or less balanced preference between rice and wheat:
Bihar (+3)
Maharashtra (−15)
Uttarakhand (−18)
Himachal Pradesh (−19).
Hence, Karnataka is likely to have a moderately high positive value (about +70), the north-eastern states show the strongest preference for rice, the north-western states show the strongest preference for wheat, and states such as Bihar, Maharashtra, Uttarakhand and Himachal Pradesh have a nearly balanced preference.
Mean Grids:
(i) Fill the grid with 9 distinct numbers such that the average along each row, column, and diagonal is 10.
(ii) Can we fill the grid by changing a few numbers and still get 10 as the average in all directions?
Answer
(i) A 3 × 3 grid has 3 numbers in each row, column, and diagonal. For the average of 3 numbers to be 10, their sum must be 3 × 10 = 30. So we need a grid in which every row, column, and diagonal adds up to 30 (this is a magic square with magic sum 30).
One such grid using 9 distinct numbers is:
| 13 | 6 | 11 |
|---|---|---|
| 8 | 10 | 12 |
| 9 | 14 | 7 |
Checking the sums:
⇒ Rows: 13 + 6 + 11 = 30, 8 + 10 + 12 = 30, 9 + 14 + 7 = 30
⇒ Columns: 13 + 8 + 9 = 30, 6 + 10 + 14 = 30, 11 + 12 + 7 = 30
⇒ Diagonals: 13 + 10 + 7 = 30, 11 + 10 + 9 = 30
Each row, column, and diagonal sums to 30, so the average along each is .
(ii) Yes. There is more than one such grid. As long as the centre number stays 10 and the numbers are arranged so that every row, column, and diagonal still adds up to 30, we can change the numbers and the average remains 10. For example:
| 14 | 5 | 11 |
|---|---|---|
| 7 | 10 | 13 |
| 9 | 15 | 6 |
Here too every row, column, and diagonal adds up to 30, so the average in all directions is again 10.
Hence, the grid can be filled (for example, with the grid above) so that every row, column, and diagonal averages 10, and many such grids are possible.
Give two examples of data that satisfy each of the following conditions:
(i) 3 numbers whose mean is 8.
(ii) 4 numbers whose median is 15.5.
(iii) 5 numbers whose mean is 13.6.
(iv) 6 numbers whose mean = median.
(v) 6 numbers whose mean > median.
Answer
(i) 3 numbers whose mean is 8. The sum must be .
⇒ Example 1: 7, 8, 9
⇒ Example 2: 2, 8, 14
(ii) 4 numbers whose median is 15.5. For four numbers, the median is the average of the 2nd and 3rd number, so the two middle numbers must add up to .
⇒ Example 1: 10, 15, 16, 20
⇒ Example 2: 1, 14, 17, 25
(iii) 5 numbers whose mean is 13.6. The sum must be .
⇒ Example 1: 12, 13, 14, 14, 15
⇒ Example 2: 10, 12, 14, 16, 16
(iv) 6 numbers whose mean = median.
⇒ Example 1: 1, 2, 3, 4, 5, 6
⇒ Example 2: 2, 4, 6, 8, 10, 12
(v) 6 numbers whose mean > median.
⇒ Example 1: 1, 2, 3, 4, 5, 100
⇒ Example 2: 1, 2, 3, 4, 5, 15
In both examples of part (v) one very large value pulls the mean up while the median stays the same.
Hence, the data sets above satisfy each of the given conditions (and many other correct examples are possible).
Fill in the blanks such that the median of the collection is 13: 5, 21, 14, ............... , ............... , ............... .
How many possibilities exist if only counting numbers are allowed?
Answer
After filling the blanks, the collection has 6 numbers.
When 6 numbers are arranged in ascending order, the median is the average of the 3rd and 4th numbers.
For the median to be 13,
Hence, the 3rd and 4th numbers must add up to 26.
One possible choice is to fill the blanks with 5, 12 and any counting number greater than or equal to 14.
For example:
If the third blank is 21, the ordered data is 5, 5, 12, 14, 21, 21
whose median is
If the third blank is 30, the ordered data is 5, 5, 12, 14, 21, 30
whose median is also
Since the last number can be 21, 22, 23..... and so on, there are infinitely many such collections.
∴ There are infinitely many possibilities.
Hence, the blanks can be filled in infinitely many ways so that the median of the collection is 13.
Fill in the blanks such that the mean of the collection is 6.5: 3, 11, ............... , ............... , 15, 6.
How many possibilities exist if only counting numbers are allowed?
Answer
There are 6 values in the collection and their mean is 6.5.
⇒ Sum of all 6 values = 6.5 × 6 = 39
⇒ Sum of the four known values = 3 + 11 + 15 + 6 = 35
Sum of the two missing values = 39 − 35 = 4.
The two missing values must therefore be counting numbers whose sum is 4. The possible pairs are:
(1, 3), (2, 2) and (3, 1)
Thus, there are 3 possible ways to fill the two blanks.
Hence, the two missing values must add up to 4, and there are 3 possible fillings using counting numbers.
Check whether each of the statements below is true. Justify your reasoning. Use algebra, if necessary, to justify.
(i) The average of two even numbers is even.
(ii) The average of any two multiples of 5 will be a multiple of 5.
(iii) The average of any 5 multiples of 5 will also be a multiple of 5.
Answer
(i) The average of two even numbers is even — This statement is false.
Let the two even numbers be 2m and 2n.
Average =
The value of m + n may be even or odd, depending on the values of m and n.
For example, the average of 2 and 4 is , which is odd.
∴ The statement is false.
(ii) The average of any two multiples of 5 will be a multiple of 5 — This statement is false.
Let the two multiples of 5 be 5a and 5b.
Average =
This is a multiple of 5 only when a + b is even.
For example, the average of 5 and 10 is , which is not a multiple of 5.
∴ The statement is false.
(iii) The average of any 5 multiples of 5 will also be a multiple of 5 — This statement is false.
Let the five multiples of 5 be 5a, 5b, 5c, 5d and 5e.
Average =
This is always a whole number, but it need not be a multiple of 5.
For example, the average of 5, 5, 5, 5 and 10 is , which is not a multiple of 5.
∴ The statement is false.
Hence, all three statements are false.
There were 2 new admissions to Sudhakar's class just a couple of days after the class average height was found to be 150.2 cm.
(i) Which of the following statements are correct? Why?
- The average height of the class will increase as there are 2 new values.
- The average height of the class will remain the same.
- The heights of the new students have to be measured to find out the new average height.
- The heights of everyone in the class has to be measured again to calculate the new average height.
(ii) The heights of the two new joinees are 149 cm and 152 cm. Which of the following statements about the class' average height are correct? Why?
- The average will remain the same.
- The average will increase.
- The average will decrease.
- The information is not sufficient to make a claim about the average.
(iii) Which of the following statements about the new class average height are correct? Why?
- The median will remain the same.
- The median will increase.
- The median will decrease.
- The information is not sufficient to make a claim about median.
Answer
(i)
The heights of the new students have to be measured to find out the new average height.
The previous average and the number of students are already known, so the total height of the class can be found. To calculate the new average, we only need to measure the heights of the two new students, add these to the previous total, and divide by the new number of students.
⇒ Statement 3 is correct — the heights of just the 2 new students need to be measured.
⇒ Statement 4 is incorrect — there is no need to measure everyone again.
⇒ Statements 1 and 2 are incorrect — adding new values may increase, decrease, or keep the average the same, depending on the new heights. Nothing can be said with certainty without knowing those heights.
Hence, option 3 is the correct option.
(ii)
The average will increase.
The average of the two new heights is
Since 150.5 cm is greater than the previous class average of 150.2 cm, adding these two students increases the class average.
∴ The new average will increase.
(This can also be checked with algebra.
If the class had n students, the new average is
.
As is less than , the new average is greater than 150.2 for every n.)
Hence, option 2 is the correct option.
(iii) The information is not sufficient to make a claim about the median.
The median depends on the actual heights of all the students, not just on the average. Since the individual heights are not known, we cannot tell whether the median will rise, fall, or stay the same on adding 149 cm and 152 cm.
∴ No claim can be made about the median.
Hence, option 4 is the correct option.
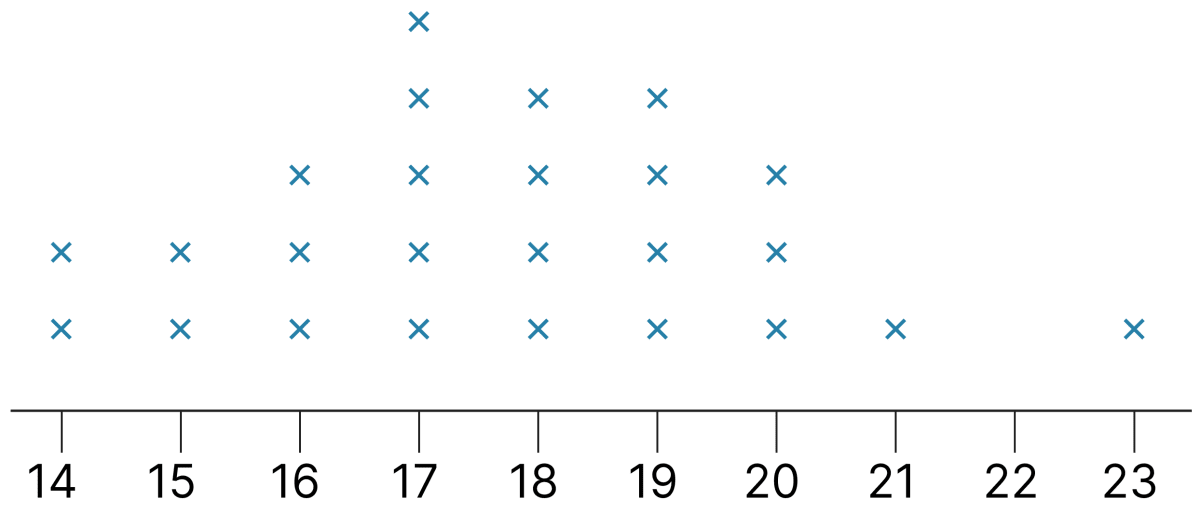
Is 17 the average of the data shown in the dot plot below? Share the method you used to answer this question.
Answer
No, 17 is not the average.
From the dot plot, the values and the number of dots above each are:
| Value | 14 | 15 | 16 | 17 | 18 | 19 | 20 | 21 | 22 | 23 |
|---|---|---|---|---|---|---|---|---|---|---|
| No. of dots | 2 | 2 | 3 | 5 | 4 | 4 | 3 | 1 | 0 | 1 |
Method 1 — Checking the balance of distances about 17.
If the mean were 17, then the total distance of the values below 17 should be equal to the total distance of the values above 17.
⇒ Total distance of values below 17 = (17 − 14) × 2 + (17 − 15) × 2 + (17 − 16) × 3 = 6 + 4 + 3 = 13
⇒ Total distance of values above 17 = (18 − 17) × 4 + (19 − 17) × 4 + (20 − 17) × 3 + (21 − 17) × 1 + (23 − 17) × 1 = 4 + 8 + 9 + 4 + 6 = 31
Since 13 ≠ 31, the data is not balanced about 17. Therefore, 17 is not the mean.
Calculating the mean,
Mean = [14(2) + 15(2) + 16(3) + 17(5) + 18(4) + 19(4) + 20(3) + 21(1) + 23(1)]/[2 + 2 + 3 + 5 + 4 + 4 + 3 + 1 + 0 + 1]
= 443/25
= 17.72
∴ The actual mean is 17.72, not 17.
Hence, 17 is not the average of the data; the mean is 17.72.
The weights of people in a group were measured every month. The average weight for the previous month was 65.3 kg and the median weight was 67 kg. The data for this month showed that one person has lost 2 kg and two have gained 1 kg. What can we say about the change in mean weight and median weight this month?
Answer
Change in mean.
The number of people in the group remains the same.
The total change in weight is
⇒ Change = (−2) + (+1) + (+1) = 0
Since the total weight does not change and the number of people remains the same, the mean remains unchanged.
∴ The mean weight this month is 65.3 kg.
Change in median.
The median depends on the ordered list of individual weights. We are not told which people lost or gained weight or where their weights lie in the ordered data.
Therefore, it is not possible to determine whether the median will increase, decrease or remain the same.
∴ The change in median cannot be determined from the given information.
Hence, the mean weight remains 65.3 kg, while the change in the median weight cannot be determined from the given information.
The following table shows the retail price (in ₹) of iodised salt in the month of January in a few states over 10 years. For your calculations and plotting you may round off values to the nearest counting number.
| Year | Andaman and Nicobar Islands | Assam | Gujarat | Mizoram | Uttar Pradesh | West Bengal |
|---|---|---|---|---|---|---|
| 2016 | 16 | 6 | 16.5 | 20 | 16.15 | 9.47 |
| 2017 | 12 | 12 | 14.75 | 20 | 16.97 | 11.65 |
| 2018 | 12 | 12 | 14.75 | 22 | 16.18 | 11.63 |
| 2019 | 12 | 12 | 14.75 | 22 | 18.24 | 11.43 |
| 2020 | 13.88 | 12 | 13 | 20 | 18.96 | 11.11 |
| 2021 | 18.22 | 15 | 14.45 | 22 | 20.63 | 12.79 |
| 2022 | 18.73 | 14 | 14.28 | 25 | 21.3 | 16.14 |
| 2023 | 20.63 | 12.02 | 14.54 | 27.65 | 25.39 | 18.43 |
| 2024 | 19.73 | 13.72 | 14.8 | 29.03 | 26.9 | 21.66 |
| 2025 | 20.99 | 12.35 | 19.2 | 29.8 | 24.81 | 23.99 |
(i) Choose data from any 3 states you find interesting and present it through a line graph using an appropriate scale.
(ii) What do you find interesting in this data? Share your observations.
(iii) Compare the price variation in Gujarat and Uttar Pradesh.
(iv) In which state has the price increased the most from 2016 to 2025?
(v) What are you curious to explore further?
Answer
(i) Any 3 states may be chosen. Taking, for example, Mizoram, Uttar Pradesh and West Bengal (rounding each price to the nearest counting number), the values are plotted year-wise on a line graph with "Year" on the horizontal axis and "Price (in ₹)" on the vertical axis.
Rounded off values are:
| Year | Mizoram | Uttar Pradesh | West Bengal |
|---|---|---|---|
| 2016 | 20 | 16 | 9 |
| 2017 | 20 | 17 | 12 |
| 2018 | 22 | 16 | 12 |
| 2019 | 22 | 18 | 11 |
| 2020 | 20 | 19 | 11 |
| 2021 | 22 | 21 | 13 |
| 2022 | 25 | 21 | 16 |
| 2023 | 28 | 25 | 18 |
| 2024 | 29 | 27 | 22 |
| 2025 | 30 | 25 | 24 |
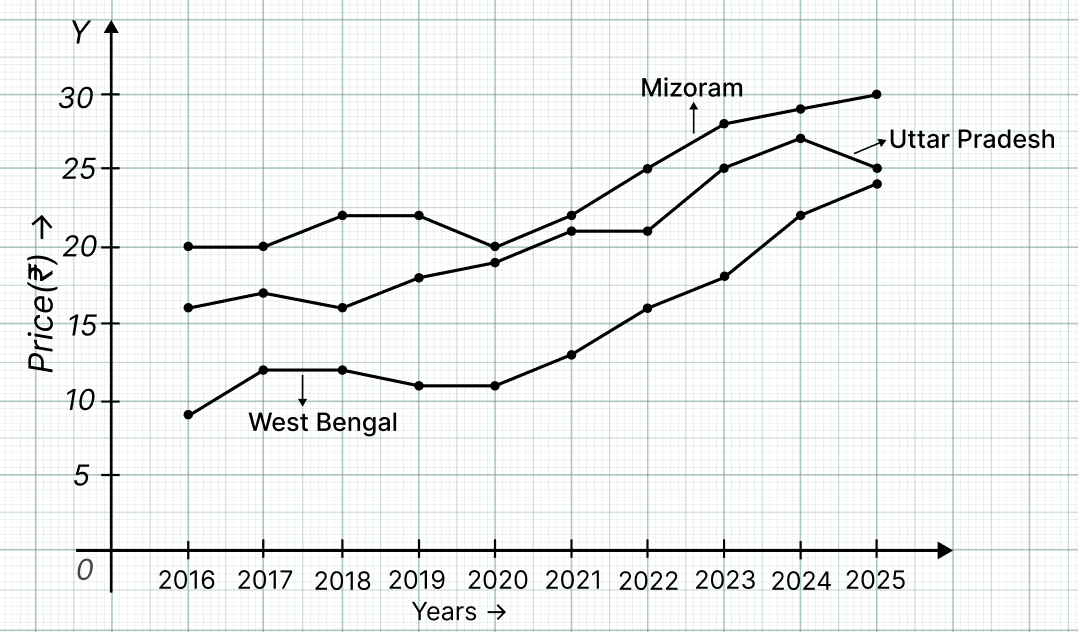
(ii) Some observations from the data:
⇒ In most states the price of iodised salt has gone up over the 10 years, but the rise is not steady — prices rise in some years and dip in others.
⇒ Mizoram has the highest prices throughout, while Assam has among the lowest, staying close to ₹12 – ₹15 for most years.
⇒ West Bengal starts as one of the cheapest states in 2016 but rises sharply to become one of the costlier ones by 2025.
(iii) Comparing Gujarat and Uttar Pradesh:
⇒ Gujarat — the price stays fairly stable, mostly between about ₹13 and ₹15 for nine of the ten years (only 2016 at ₹16.5 and 2025 at ₹19.2 stand apart). There is little overall change and small variation.
⇒ Uttar Pradesh — the price shows a clear upward trend, climbing steadily from about ₹16 in 2016 to about ₹27 in 2024 (with a small dip to about ₹25 in 2025). The variation is much larger.
∴ Gujarat's price is comparatively stable, whereas Uttar Pradesh's price varies a lot and rises steadily over the years.
(iv) The increase in price from 2016 to 2025 for each state is:
| State | 2016 | 2025 | Increase |
|---|---|---|---|
| Andaman and Nicobar Islands | 16 | 21 | 5 |
| Assam | 6 | 12 | 6 |
| Gujarat | 17 | 19 | 2 |
| Mizoram | 20 | 30 | 10 |
| Uttar Pradesh | 16 | 25 | 9 |
| West Bengal | 9 | 24 | 15 |
(Prices rounded to the nearest counting number.)
The largest increase, about ₹15 (from ₹9.47 to ₹23.99), is in West Bengal.
∴ West Bengal's price increased the most from 2016 to 2025.
(v) This is open to exploration. One might be curious to find out why prices vary so much between states (transport cost, distance from production sites, local taxes), why island and hilly states such as the Andaman and Nicobar Islands and Mizoram have higher prices, or how the price of iodised salt compares with the price of ordinary salt over the same years.
Hence, Gujarat's price stayed relatively stable while Uttar Pradesh's rose steadily, and the price increased the most in West Bengal (about ₹15) from 2016 to 2025.
Referring to the graph below, which of the following statements are valid? Why?
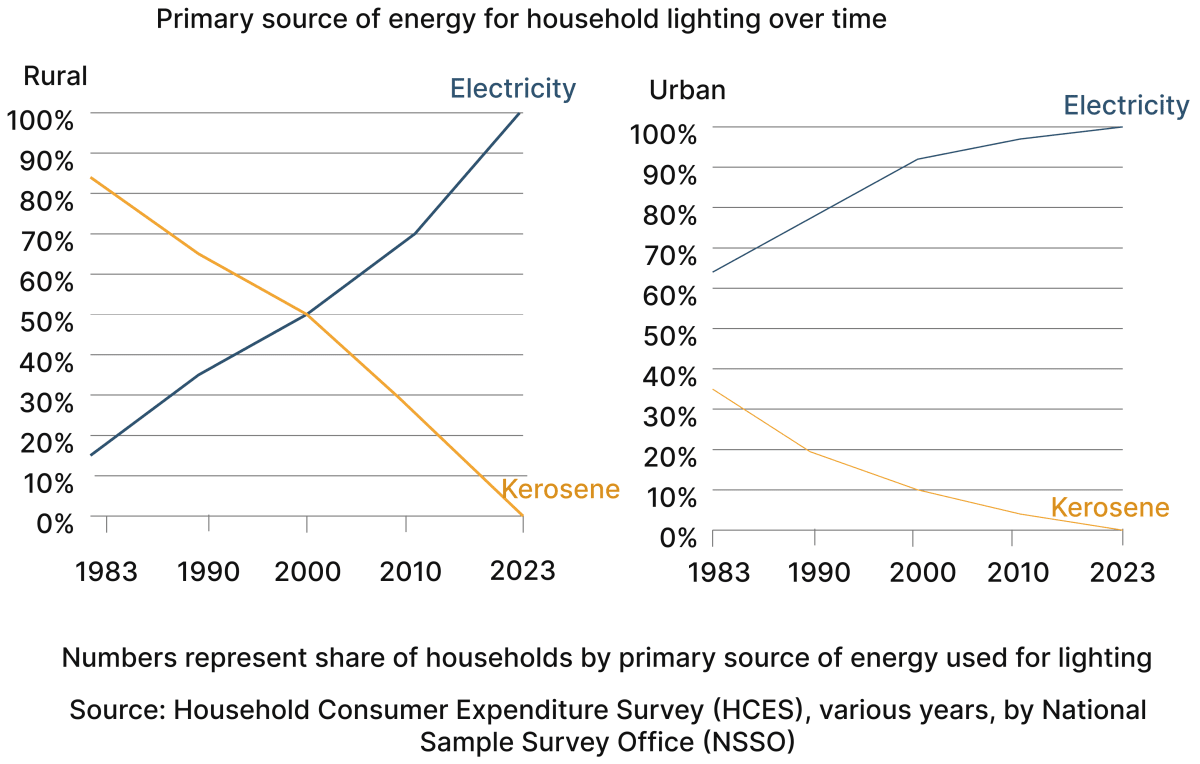
(i) In 1983, the majority in rural areas used kerosene as a primary lighting source while the majority in urban areas used electricity.
(ii) The use of kerosene as a primary lighting source has decreased over time in both rural and urban areas.
(iii) In the year 2000, 10% of the urban households used electricity as a primary lighting source.
(iv) In 2023, there were no power cuts.
Answer
(i) Valid.
In 1983, about 85% of rural households used kerosene as their primary source of lighting, while only about 15% used electricity. In urban areas, about 64% of households used electricity, while about 34% used kerosene.
⇒ The statement matches the graph.
(ii) Valid.
In both the rural and the urban graphs, the kerosene line falls steadily from 1983 to 2023, dropping to nearly 0%.
⇒ The use of kerosene has decreased over time in both areas.
(iii) Not valid.
In the year 2000, the urban electricity line is at about 90%, not 10%. (It is the urban kerosene line that is close to 10% around that year.)
∴ The statement is not valid.
(iv) Not valid.
The graph shows only the primary source of energy used for household lighting. It does not provide any information about the availability or reliability of electricity supply or about power cuts.
∴ No conclusion about power cuts can be drawn from the graph.
Hence, statements (i) and (ii) are valid, while statements (iii) and (iv) are not.
Answer the following questions based on the line graph.
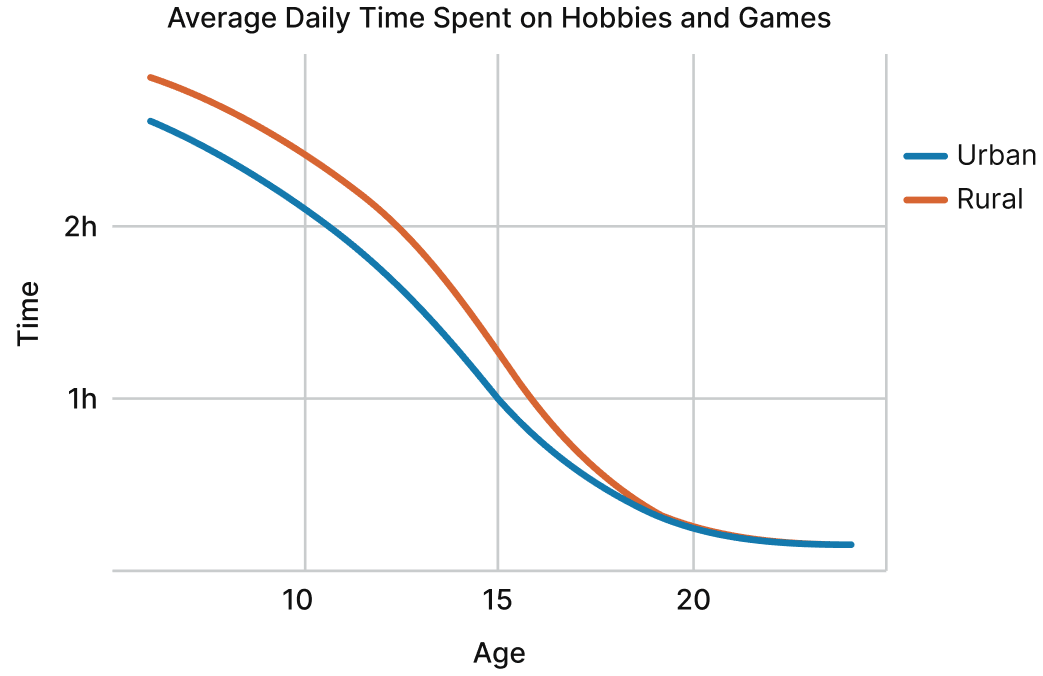
(i) How long do children aged 10 in urban areas spend each day on hobbies and games?
(ii) At what age is the average time spent daily on hobbies and games by rural kids 1.5 hours?
- 8 years
- 10 years
- 12 years
- 14 years
- 18 years
(iii) Are the following statements correct?
- The average time spent daily on hobbies and games by kids aged 15 is twice that of kids aged 10.
- All rural kids aged 15 spend at least 1 hour on hobbies and games everyday.
Answer
(i) Reading the urban (blue) line at age 10, the time is about 2 hours per day.
(ii) The rural (red) line reaches 1.5 hours (halfway between the 1 h and 2 h gridlines) at age 14 years.
∴ The correct option is 4.
(iii)
1. Incorrect.
From the graph, children aged 10 spend about 2 hours per day, while children aged 15 spend about 1 hour per day.
Thus, the average time at age 15 is about half of that at age 10, not twice.
2. Incorrect.
The graph shows the average time spent by rural children of a particular age. It does not show the time spent by each individual child.
Therefore, we cannot conclude that all rural children aged 15 spend at least 1 hour every day.
Hence, urban children aged 10 spend about 2 hours per day on hobbies and games, rural children spend about 1.5 hours at around 14 years of age, and both statements in part (iii) are incorrect.
The following graphs show the sunrise and sunset times across the year at 4 locations in India. Observe how the graphs are organised. Are you able to identify which lines indicate the sunrise and which indicate the sunset?
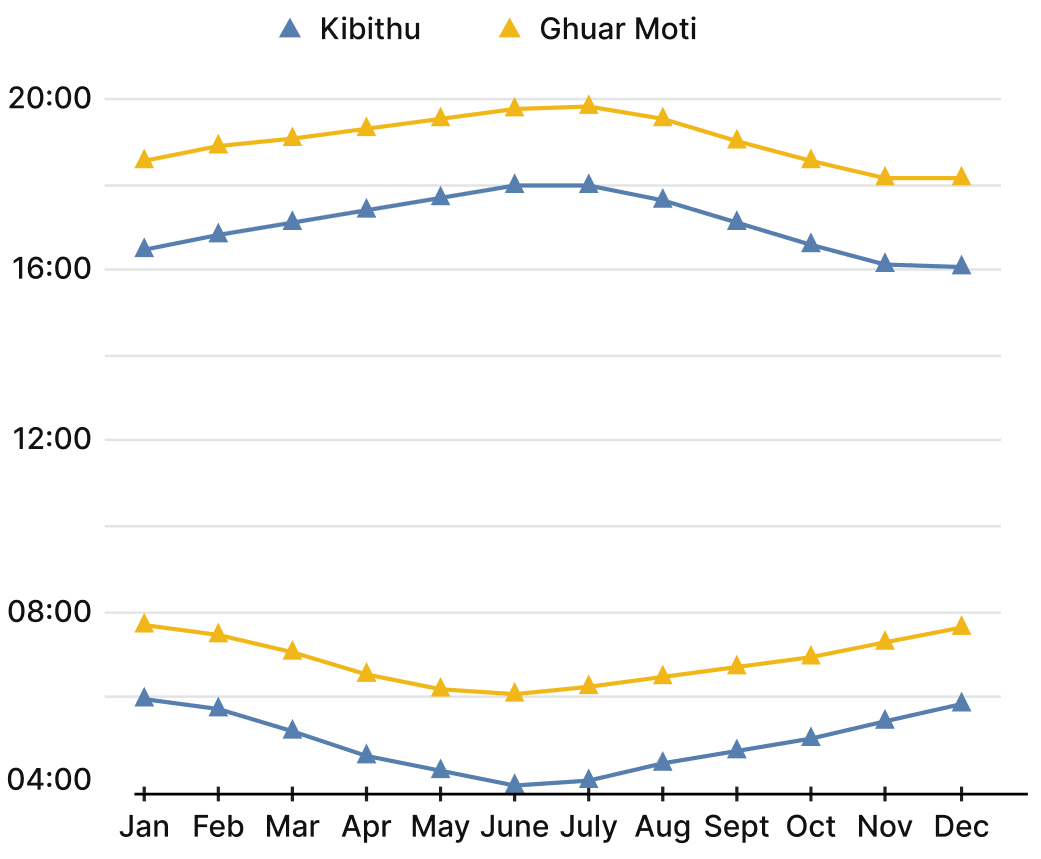
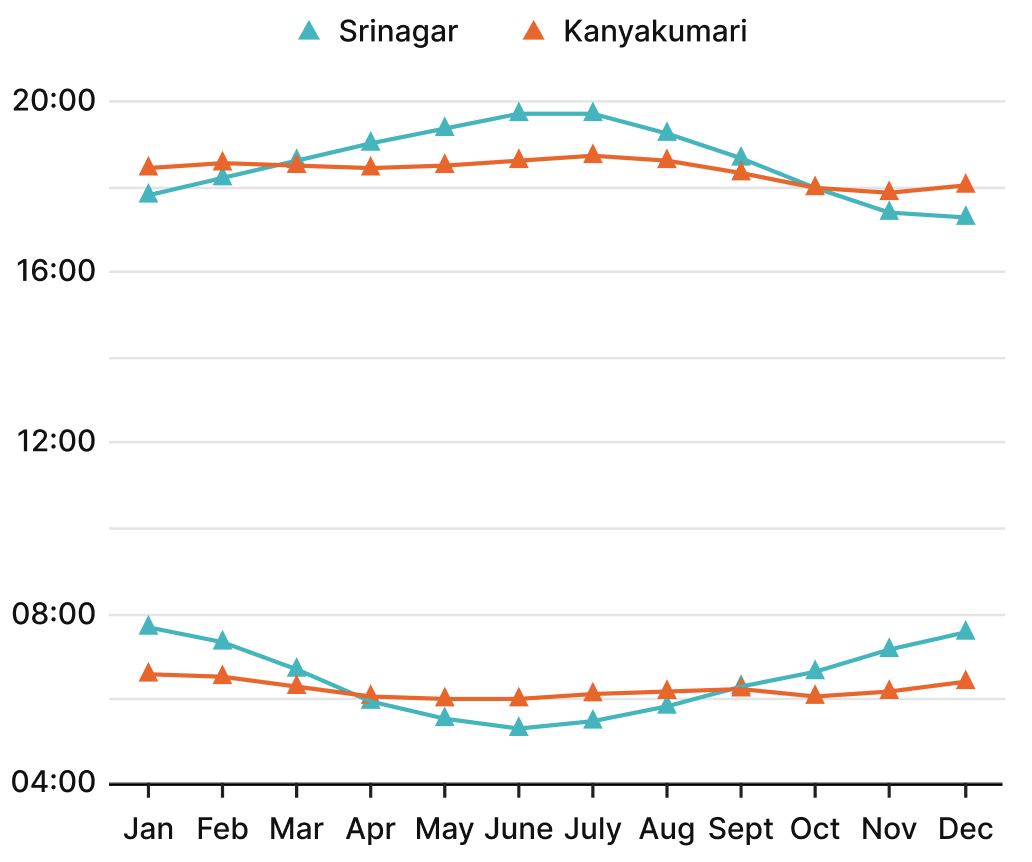
Answer the following questions based on the graphs:
(i) At which place does the sun rise the earliest in January? What is the approximate day length at this place in January?
(ii) Which place has the longest day length over the year?
(iii) Share your observations — what do you find interesting? What are you curious to find out?
Answer
In each graph, the lower pair of lines (near 04:00 – 08:00) shows the sunrise times and the upper pair of lines (near 16:00 – 20:00) shows the sunset times. The day length at any place is the gap between its sunset and sunrise lines.
(i) In January, comparing the sunrise (lower) lines of all four places, Kibithu has the earliest sunrise, at about 06:00. (Ghuar Moti and Srinagar rise around 07:30 – 07:45, and Kanyakumari around 06:30.)
At Kibithu in January, the sun rises at about 06:00 and sets at about 16:15.
⇒ Day length ≈ 16:15 − 06:00 ≈ 10 hours 15 minutes.
Hence, the sun rises earliest at Kibithu, and the day length there in January is about 10 hours 15 minutes.
(ii) Among the four places, Srinagar has the longest day length during the year.
Around June–July, the sun rises at about 5:15 a.m. and sets at about 7:45 p.m., giving a day length of about 14½ hours, which is the longest among the four places.
∴ Srinagar has the longest day length over the year.
(iii) Some observations:
⇒ Places in the east, such as Kibithu, have earlier sunrise and sunset times than places in the west, such as Ghuar Moti.
⇒ Places far from the equator (Srinagar) show a big difference between summer and winter day lengths, while places near the equator (Kanyakumari) have day lengths that stay close to 12 hours all year.
⇒ For every place, the day is longest around June – July and shortest around December – January.
One might be curious to find out
How these timings would look for places at the same latitude but different longitudes?
How far north a place must be before the day-length difference becomes very large.
Hence, eastern locations have earlier sunrise and sunset times, while places farther from the equator show greater seasonal variation in day length.
We all know the typical sunrise and sunset timings. Do you know when the moon rises and sets? Does it follow a regular pattern like the sun? Let's find out. The following graph shows the moonrise and moonset time over a month:
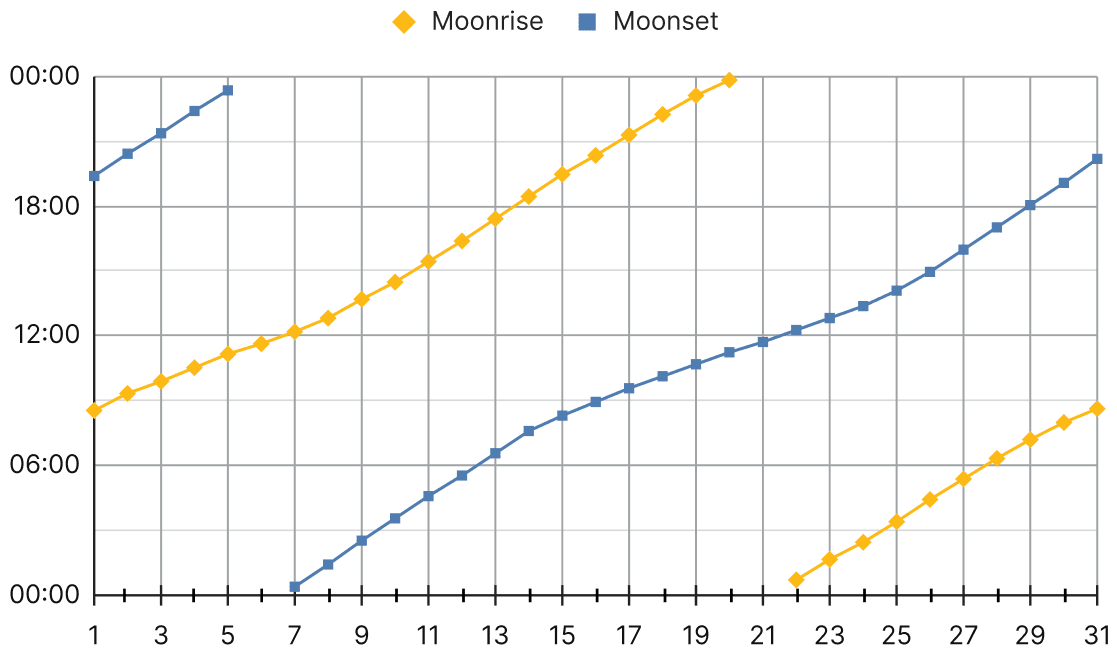
(i) Find out on what dates amavasya (new moon) and purnima (full moon) were in this month.
(ii) What do you notice? What do you wonder?
Answer
(i)
On purnima (full moon) the moon rises around sunset and sets around sunrise, so it is up all night.
On amavasya (new moon) the moon rises around sunrise and sets around sunset, so it is up with the sun during the day.
⇒ The moonrise (gold) line reaches about 18:00 (sunset) and the moonset (blue) line reaches about 06:00 (sunrise) at around the 13th – 14th of the month. So purnima (full moon) was around the 13th – 14th.
∴ Purnima was around the 13th–14th.
⇒ The moonrise (gold) line is at about 06:00 (sunrise) and the moonset (blue) line is at about 18:00 (sunset) at around the 28th–29th of the month. So amavasya (new moon) was around the 28th–29th.
∴ Amavasya was around the 28th–29th.
(ii) Some things to notice and wonder about:
Unlike the Sun, the Moon does not rise and set at nearly the same time every day.
The moonrise and moonset times become later each day, by roughly 45–50 minutes.
The moonrise and moonset lines wrap around the graph because the times pass midnight.
The gap between Purnima and Amavasya is about 14–15 days, which agrees with the lunar cycle.
Hence, purnima (full moon) was around the 13th–14th and amavasya (new moon) around the 28th–29th, and the Moon rises and sets roughly 45–50 minutes later each day through the month.