
Without plotting the points indicate the quadrant they will lie, if
(i) ordinate is 5 and abscissa is -3
(ii) abscissa is -5 and ordinate is -3
(iii) abscissa is -5 and ordinate is 3
(iv) ordinate is 5 and abscissa is 3.
Answer
(i) The abscissa is -3 and the ordinate is 5, so the point is (-3, 5).
Here, the abscissa is negative and the ordinate is positive.
Hence, the point lies in the II quadrant.
(ii) The abscissa is -5 and the ordinate is -3, so the point is (-5, -3).
Here, both the abscissa and the ordinate are negative.
Hence, the point lies in the III quadrant.
(iii) The abscissa is -5 and the ordinate is 3, so the point is (-5, 3).
Here, the abscissa is negative and the ordinate is positive.
Hence, the point lies in the II quadrant.
(iv) The abscissa is 3 and the ordinate is 5, so the point is (3, 5).
Here, both the abscissa and the ordinate are positive.
Hence, the point lies in the I quadrant.
Plot the point P(-3, 4). Draw PM and PN perpendiculars to x-axis and y-axis respectively. Write the coordinates of the points M and N.
Answer
Draw the coordinate axes on a graph paper.
Start from the origin O, move 3 units to the left along the x-axis and then move 4 units upwards parallel to the y-axis. Mark this point as P(-3, 4).
From P, draw PM perpendicular to the x-axis and PN perpendicular to the y-axis.
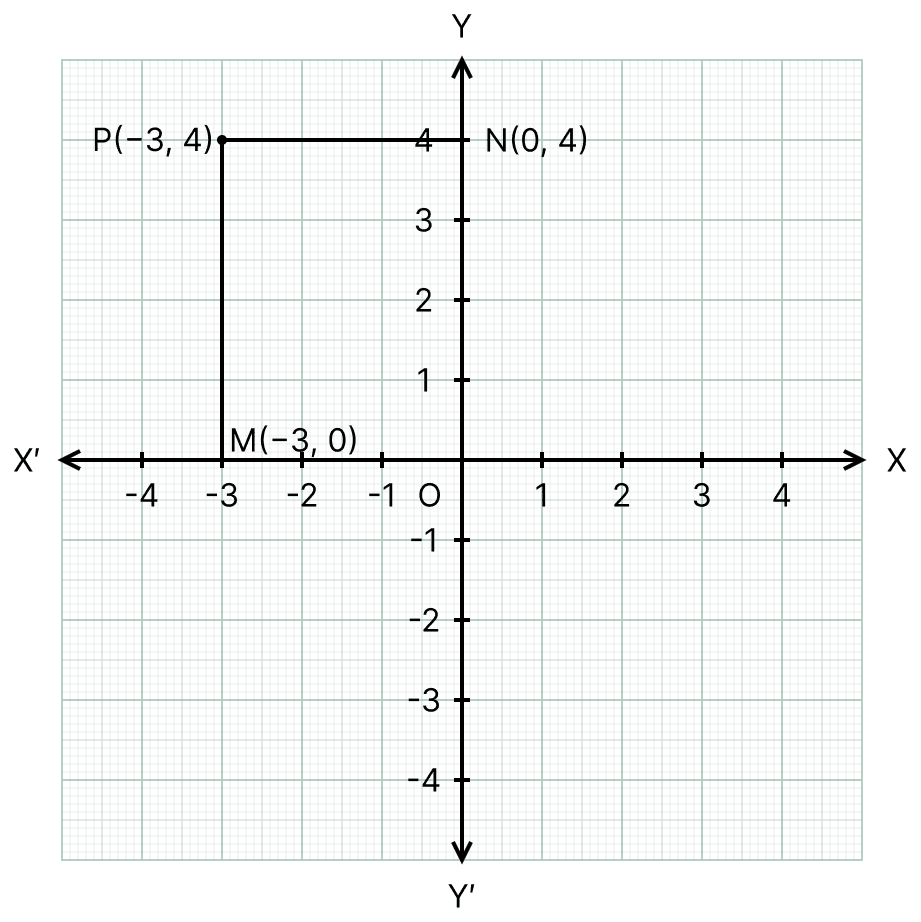
The point M is the foot of the perpendicular drawn from P to the x-axis.
So, M lies on the x-axis and its ordinate is 0, while its abscissa is the same as that of P, that is, -3.
The point N is the foot of the perpendicular drawn from P to the y-axis.
So, N lies on the y-axis and its abscissa is 0, while its ordinate is the same as that of P, that is, 4.
Hence, the coordinates of the points are M(-3, 0) and N(0, 4).
Plot the points A(1, 2), B(2, -1) and C(-1, 4) and check whether they are collinear or not.
Answer
Draw the coordinate axes on a graph paper and plot the points A(1, 2), B(2, -1) and C(-1, 4) on it.
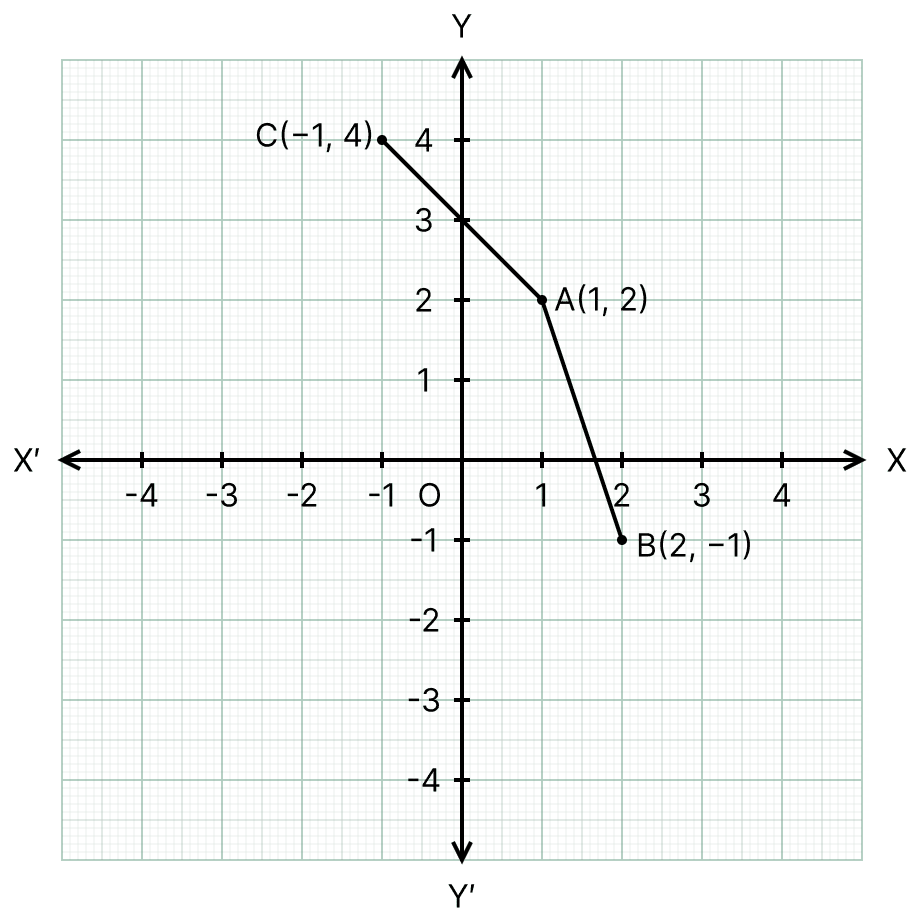
We note that the line passing through A and B does not pass through the point C(-1, 4).
Thus the three points do not lie on the same straight line.
Hence, the points A(1, 2), B(2, -1) and C(-1, 4) are non-collinear.
The following table gives the growth of a child.
| Height (in cm) | Age (in years) |
|---|---|
| 75 | 2 |
| 90 | 4 |
| 110 | 6 |
| 120 | 8 |
| 130 | 10 |
Draw a graph for the data given above and answer the following questions:
(i) What is the height at the age of 5 years?
(ii) How much taller was the child at the age of 8 than at the age of 4?
(iii) Between which two consecutive periods did the child grow fastest?
Answer
Represent the age (in years) along the x-axis and the height (in cm) along the y-axis.
Scale: Take,
1 unit on x-axis = 2 years,
1 unit on y-axis = 10 cm.
A break is shown near the origin to indicate that the scale on the y-axis starts at 70 cm.
Plot the points (2, 75), (4, 90), (6, 110), (8, 120) and (10, 130) on the graph paper and join the consecutive points by line segments.
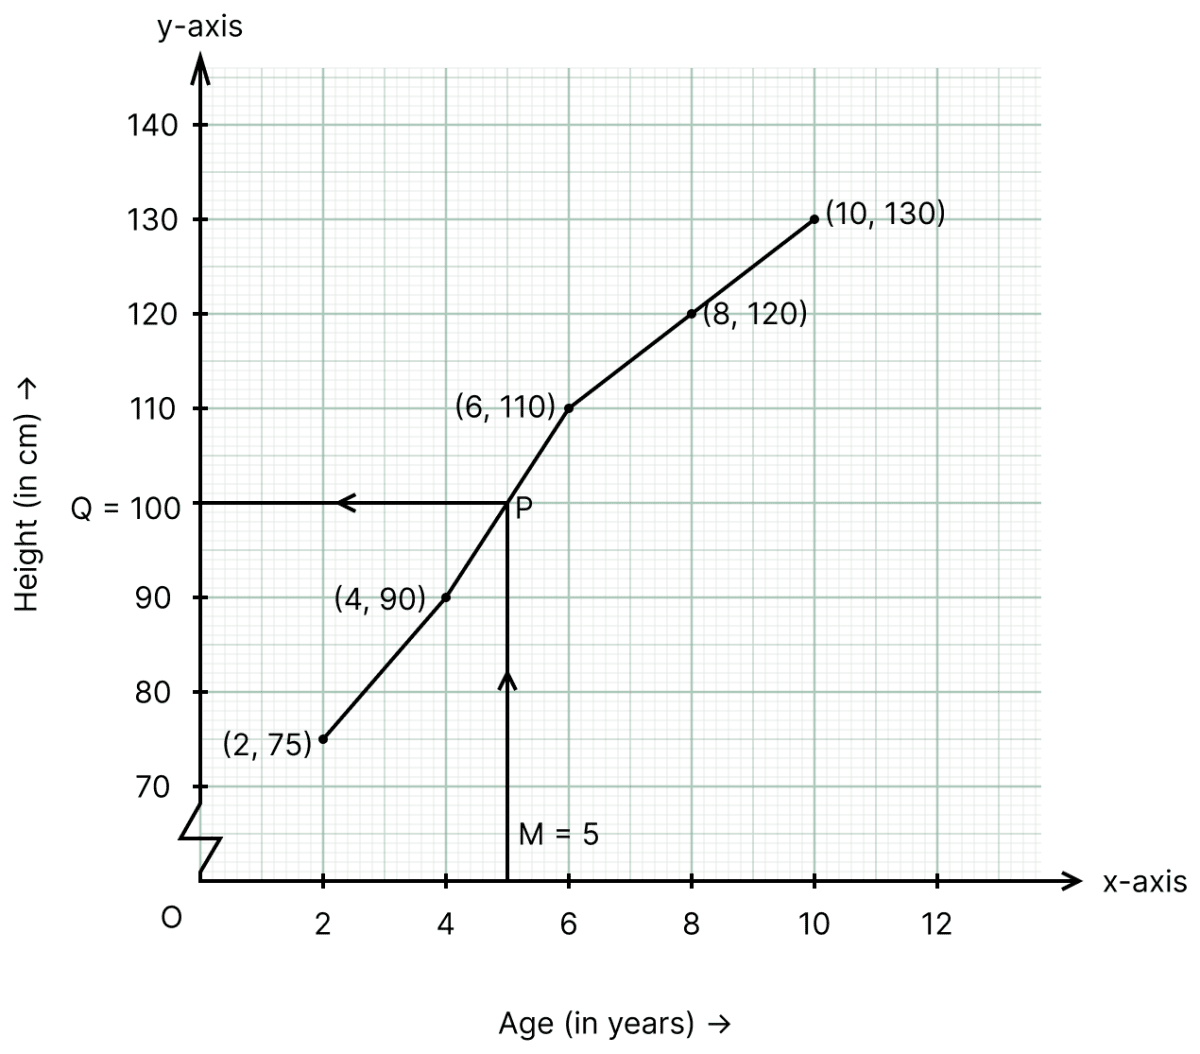
(i) Corresponding to the age of 5 years, locate a point M on the x-axis and draw a vertical line through M to meet the graph at P.
From P, draw a horizontal line to meet the y-axis at the point Q.
The point Q represents 100.
Hence, the height at the age of 5 years is 100 cm.
(ii) From the graph,
Height at the age of 8 years = 120 cm
Height at the age of 4 years = 90 cm
Difference in the heights = 120 cm - 90 cm = 30 cm
Hence, the child was 30 cm taller at the age of 8 than at the age of 4.
(iii) The child grows fastest during the period in which the graph is the steepest.
From the graph, the growth in height during the consecutive periods is as follows:
Between 2 years and 4 years = 90 cm - 75 cm = 15 cm
Between 4 years and 6 years = 110 cm - 90 cm = 20 cm
Between 6 years and 8 years = 120 cm - 110 cm = 10 cm
Between 8 years and 10 years = 130 cm - 120 cm = 10 cm
The greatest growth of 20 cm is between 4 years and 6 years.
Hence, the child grew fastest between 4 years and 6 years.