
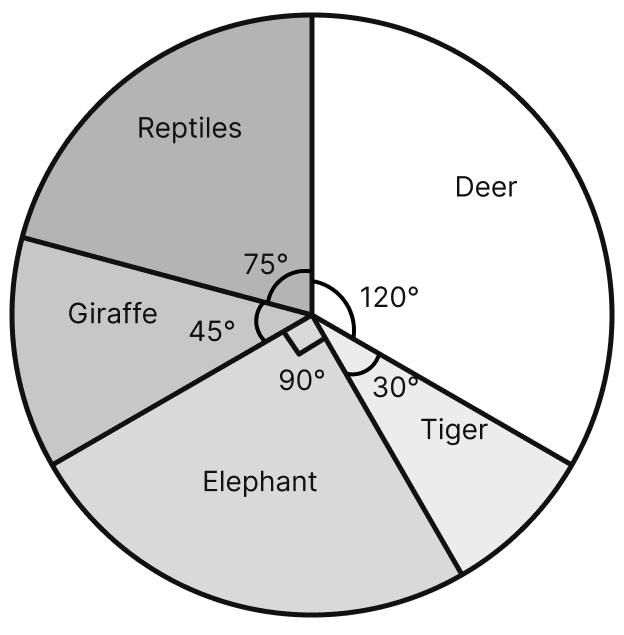
The following data represents the different number of animals in a zoo. Prepare a pie chart for the given data.
| Animals | Number of animals |
|---|---|
| Deer | 40 |
| Tiger | 10 |
| Elephant | 30 |
| Giraffe | 15 |
| Reptiles | 25 |
Answer
To construct a pie chart, the angles for various sectors can be calculated as:
Total number of animals = 40 + 10 + 30 + 15 + 25 = 120
| Animals | Number of animals | Angle |
|---|---|---|
| Deer | 40 | (40/120) × 360° = 120° |
| Tiger | 10 | (10/120) × 360° = 30° |
| Elephant | 30 | (30/120) × 360° = 90° |
| Giraffe | 15 | (15/120) × 360° = 45° |
| Reptiles | 25 | (25/120) × 360° = 75° |
Steps:
Draw a circle of any radius.
Draw a horizontal radius of the circle.
The angle of sector for deer is 120°. Using protractor, draw an angle of 120° on the horizontal radius.
Continue marking the remaining sectors moving in clockwise direction till all the sectors are marked.
Shade the sectors with different colours/designs and write the information in the sectors.
Thus the required pie chart is obtained.
The following data represents the monthly expenditure of a family (in ₹) on various items.
| Items | Expenditure (in ₹) |
|---|---|
| Food | 12500 |
| House rent | 5000 |
| Education | 7500 |
| Savings | 10000 |
| Health | 5000 |
| Others | 10000 |
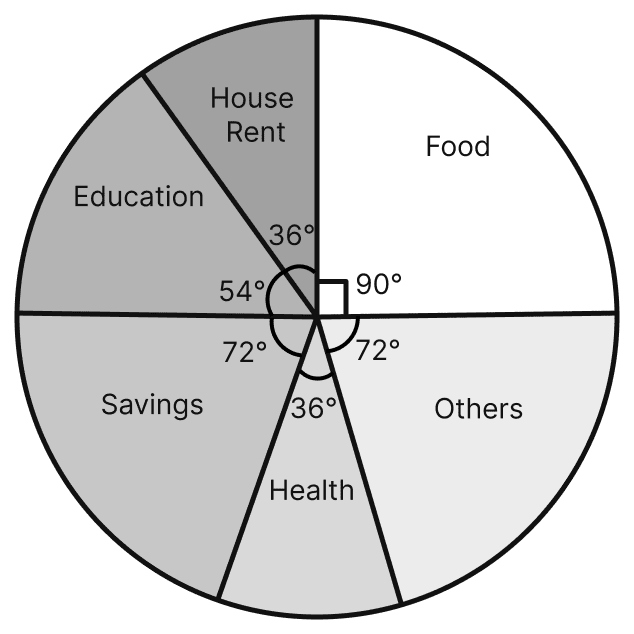
Draw a pie chart to represent this data.
Answer
To construct a pie chart, the angles for various sectors can be calculated as:
Total monthly expenditure = ₹ (12,500 + 5,000 + 7,500 + 10,000 + 5,000 + 10,000) = ₹ 50,000
| Items | Expenditure (in ₹) | Angle |
|---|---|---|
| Food | 12,500 | (12,500/50,000) × 360° = 90° |
| House rent | 5,000 | (5,000/50,000) × 360° = 36° |
| Education | 7,500 | (7,500/50,000) × 360° = 54° |
| Savings | 10,000 | (10,000/50,000) × 360° = 72° |
| Health | 5,000 | (5,000/50,000) × 360° = 36° |
| Others | 10,000 | (10,000/50,000) × 360° = 72° |
Steps:
Draw a circle of any radius.
Draw a horizontal radius of the circle.
The angle of sector for food is 90°. Using protractor, draw an angle of 90° on the horizontal radius.
Continue marking the remaining sectors moving in clockwise direction till all the sectors are marked.
Shade the sectors with different colours/designs and write the information in the sectors.
Thus the required pie chart is obtained.
The following data represents the percentage distribution of the expenditure incurred in publishing a book.
| Items | Expenditure (in %) |
|---|---|
| Paper cost | 25% |
| Printing cost | 20% |
| Binding | 20% |
| Royalty | 10% |
| Transportation cost | 15% |
| Promotion cost | 10% |
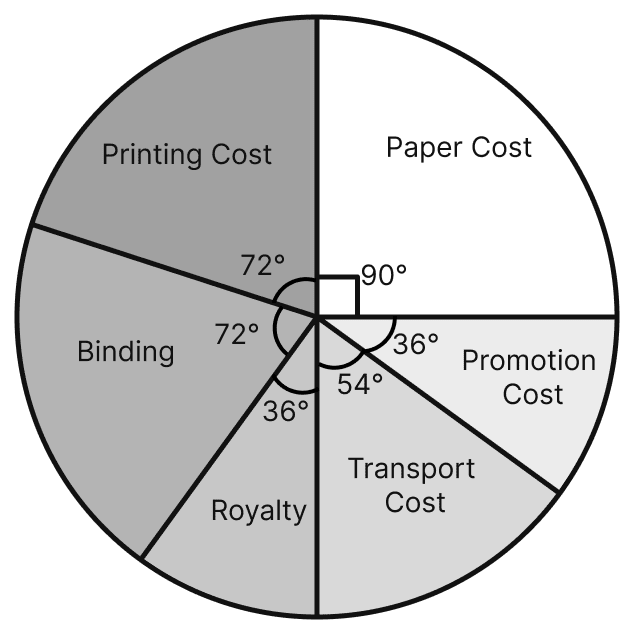
Draw a pie chart to represent this data.
Answer
To construct a pie chart, the angles for various sectors can be calculated as:
Total of all the percentages = 25 + 20 + 20 + 10 + 15 + 10 = 100
| Items | Expenditure (in %) | Angle |
|---|---|---|
| Paper cost | 25% | (25/100) × 360° = 90° |
| Printing cost | 20% | (20/100) × 360° = 72° |
| Binding | 20% | (20/100) × 360° = 72° |
| Royalty | 10% | (10/100) × 360° = 36° |
| Transportation cost | 15% | (15/100) × 360° = 54° |
| Promotion cost | 10% | (10/100) × 360° = 36° |
Steps:
Draw a circle of any radius.
Draw a horizontal radius of the circle.
The angle of sector for paper cost is 90°. Using, protractor draw an angle of 90° on the horizontal radius.
Continue marking the remaining sectors moving in clockwise direction till all the sectors are marked.
Shade the sectors with different colours/designs and write the information in the sectors.
Thus the required pie chart is obtained.
The following data represents the number of students got admission in different streams of a college:
| Stream | Number of students |
|---|---|
| Science | 400 |
| Arts | 300 |
| Commerce | 500 |
| Law | 250 |
| Management | 350 |
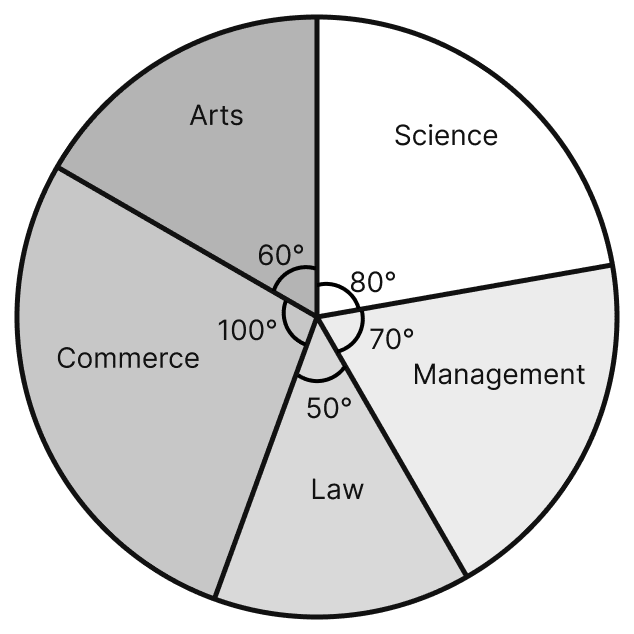
Draw a pie chart to represent this data.
Answer
To construct a pie chart, the angles for various sectors can be calculated as:
Total number of students = 400 + 300 + 500 + 250 + 350 = 1800
| Stream | Number of students | Angle |
|---|---|---|
| Science | 400 | (400/1800) × 360° = 80° |
| Arts | 300 | (300/1800) × 360° = 60° |
| Commerce | 500 | (500/1800) × 360° = 100° |
| Law | 250 | (250/1800) × 360° = 50° |
| Management | 350 | (350/1800) × 360° = 70° |
Steps:
Draw a circle of any radius.
Draw a horizontal radius of the circle.
The angle of sector for science is 80°. Using protractor, draw an angle of 80° on the horizontal radius.
Continue marking the remaining sectors moving in clockwise direction till all the sectors are marked.
Shade the sectors with different colours/designs and write the information in the sectors.
Thus the required pie chart is obtained.
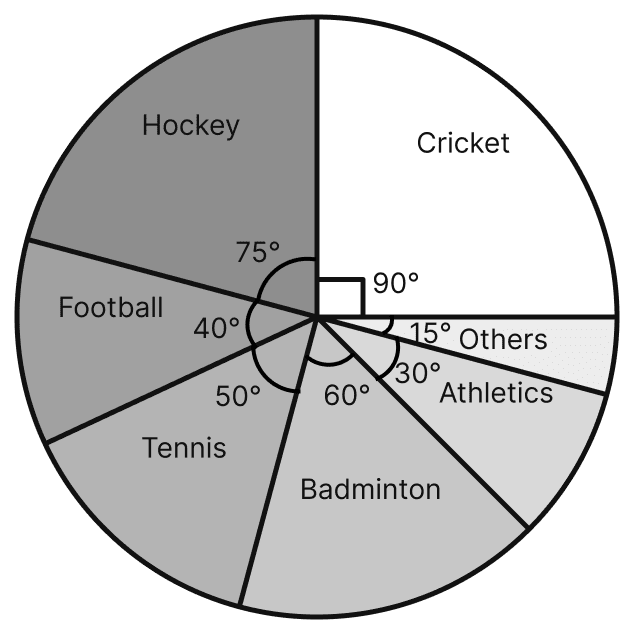
The adjoining pie chart shows the expenditure of a state government on various sports during year 2023. Study the pie chart carefully and answer the following questions:
(i) What percent of total expenditure is spent on cricket?
(ii) How much percent more is spent on hockey than that on tennis?
(iii) If the total amount spent on sports in 2023 be ₹ 1,80,00,000, then find amount spent on Badminton.
(iv) If the total amount spent on sports in 2023 be ₹ 2,40,00,000 then find the amount spent on cricket and hockey together.
Answer
To find the answers of the questions given above, we have to find the central angles of the sectors of the different sports.
From the pie chart, the central angles of the sectors are:
| Sports | Central angle |
|---|---|
| Cricket | 90° |
| Hockey | 75° |
| Football | 40° |
| Tennis | 50° |
| Badminton | 60° |
| Athletics | 30° |
| Others | 15° |
(i) The central angle of the sector for cricket = 90°
⇒ Percent spent on cricket = × 100%
= × 100%
= 25%
Hence, 25% of the total expenditure is spent on cricket.
(ii) The central angle of the sector for hockey = 75°
The central angle of the sector for tennis = 50°
∴ Difference in the central angles = 75° - 50° = 25°
⇒ Required percent = × 100%
= %
= 6.94%
Hence, 6.94% (approx.) more is spent on hockey than on tennis.
(iii) The central angle of the sector for badminton = 60° and the total amount spent = ₹ 1,80,00,000
⇒ Amount spent on badminton = × 1,80,00,000
= × 1,80,00,000
= 30,00,000
Hence, the amount spent on badminton is ₹ 30,00,000.
(iv) The central angle of the sector for cricket = 90°
The central angle of the sector for hockey = 75°
∴ Total central angle for cricket and hockey = 90° + 75° = 165°
The total amount spent = ₹ 2,40,00,000
⇒ Required amount = × 2,40,00,000
= × 2,40,00,000
= 1,10,00,000
Hence, the amount spent on cricket and hockey together is ₹ 1,10,00,000.
The adjoining pie chart shows the number of students enrolled from class VI to class X of a school.
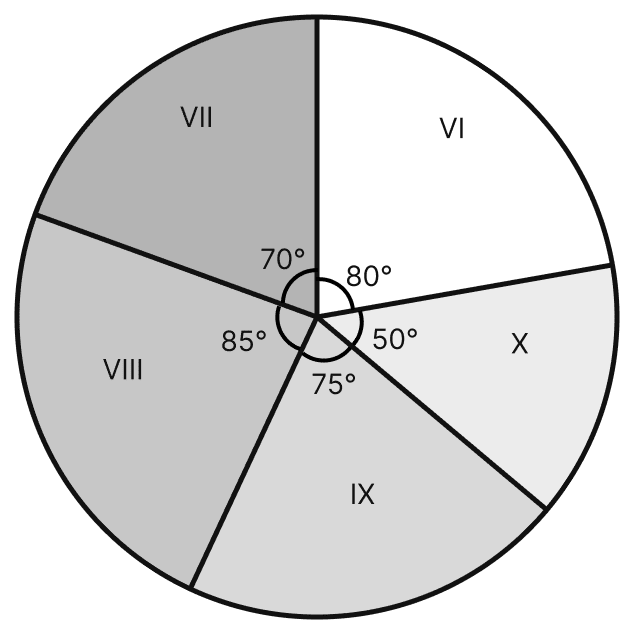
If 1440 students are enrolled from VI to X, then answer the following questions:
(i) How many students are enrolled in class VIII?
(ii) How many students are more in class IX than in class X?
(iii) What is the sum of students enrolled in VII and VIII?
(iv) Find the ratio of students enrolled in VI to students enrolled in X.
Answer
To find the answers of the questions given above, we have to find the number of students enrolled in the different classes.
Given, the total number of students enrolled from VI to X = 1440
| Class | Central angle | Number of students |
|---|---|---|
| VI | 80° | (80°/360°) × 1440 = 320 |
| VII | 70° | (70°/360°) × 1440 = 280 |
| VIII | 85° | (85°/360°) × 1440 = 340 |
| IX | 75° | (75°/360°) × 1440 = 300 |
| X | 50° | (50°/360°) × 1440 = 200 |
(i) Number of students enrolled in class VIII = 340
Hence, 340 students are enrolled in class VIII.
(ii) Number of students enrolled in class IX = 300
Number of students enrolled in class X = 200
∴ Required number of students = 300 - 200 = 100
Hence, 100 students are more in class IX than in class X.
(iii) Number of students enrolled in class VII = 280
Number of students enrolled in class VIII = 340
∴ Sum of students enrolled in VII and VIII = 280 + 340 = 620
Hence, 620 students are enrolled in classes VII and VIII together.
(iv) Number of students enrolled in class VI = 320
Number of students enrolled in class X = 200
⇒ Required ratio = 320 : 200
⇒ Required ratio = 8 : 5
Hence, the ratio of students enrolled in VI to students enrolled in X is 8 : 5.