
Find the mean and the median of the following set of numbers :
8, 0, 5, 3, 2, 9, 1, 5, 4, 7, 2, 5.
Answer
By formula,
Mean =
Sum of observations = 8 + 0 + 5 + 3 + 2 + 9 + 1 + 5 + 4 + 7 + 2 + 5 = 51.
By arranging data in ascending order, we get :
0, 1, 2, 2, 3, 4, 5, 5, 5, 7, 8, 9
Here, n = 12 which is even.
By formula,
Median =
Substituting the values we get,
Hence, mean = 4.25 and median = 4.5
Find the mean and the median of all the (positive) factors of 48.
Answer
Positive factors of 48 :
1, 2, 3, 4, 6, 8, 12, 16, 24, 48.
By formula,
Sum of positive factors of 48 = 1 + 2 + 3 + 4 + 6 + 8 + 12 + 16 + 24 + 48 = 124.
Mean
Here, n = 10 which is even.
By formula,
Median =
Substituting the values we get,
Hence, mean = 12.4 and median = 7.
The mean weight of 60 students of a class is 52.75 kg. If the mean weight of 35 of them is 54 kg, find the mean weight of the remaining students.
Answer
By formula,
Mean =
Given,
Mean weight of 60 students of a class = 52.75 kg
Mean weight of 35 students among them = 54 kg.
So, the total weight of 35 students = 54 × 35 = 1890 kg.
Remaining students = 60 – 35 = 25
Total weight of 25 students = 3165 – 1890 = 1275 kg
Mean weight of 25 students = = 51 kg.
Hence, the mean weight of the remaining students is 51 kg.
The mean age of 18 students of a class is 14.5 years. Two more students of age 15 years and 16 years join the class. What is the new mean age?
Answer
By formula,
Total age of 20 students = 261 + 15 + 16 = 292 years.
So, mean age of 20 students = = 14.6 years.
Hence, the new mean age is 14.6 years.
If the mean of the five observations x + 1, x + 3, x + 5, 2x + 2, 3x + 3 is 14, find the mean of first three observations.
Answer
By formula,
Mean =
Sum of observations = x + 1 + x + 3 + x + 5 + 2x + 2 + 3x + 3 = 8x + 14.
Given,
Mean of the five observations = 14.
First three observations are
⇒ x + 1 = 7 + 1 = 8,
⇒ x + 3 = 7 + 3 = 10,
⇒ x + 5 = 7 + 5 = 12.
Mean = = 10.
Hence, the mean of first three observations is 10.
The mean height of 36 students of a class is 150.5 cm. Later on, it was detected that the height of one student was wrongly copied as 165 cm instead of 156 cm. Find the correct mean height.
Answer
By formula,
Mean =
Given,
Mean height of 36 students of a class = 150.5 cm
As, height of one student was wrongly copied as 165 cm instead of 156 cm.
∴ Actual total height = 5418 – 165 + 156 = 5409 cm.
Actual Mean height = = 150.25
Hence, the correct mean height is 150.25 cm.
The mean of 40 items is 35. Later on, it was discovered that two items were misread as 36 and 29 instead of 63 and 22. Find the correct mean.
Answer
By formula,
Mean =
Given,
Mean of 40 items = 35
Since,
Sum of two items were misread as 36 and 29 instead of 63 and 22.
Actual sum of observation = 1400 - 36 - 29 + 63 + 22
= 1420.
Correct mean = = 35.5
Hence, the correct mean is 35.5
The following observations have been arranged in ascending order. If the median of the data is 63, find the value of x.
29, 32, 48, 50, x, x + 2, 72, 75, 87, 91.
Answer
Here n = 10, which is even.
By formula,
Hence, the value of x = 62.
Draw a histogram showing marks obtained by the students of a school in a Mathematics paper carrying 60 marks.
| Marks | Students |
|---|---|
| 0 - 10 | 4 |
| 10 - 20 | 5 |
| 20 - 30 | 10 |
| 30 - 40 | 8 |
| 40 - 50 | 30 |
| 50 - 60 | 40 |
Answer
Steps of construction of histogram :
Take 2 cm along x-axis = 10 marks.
Take 1 cm along y-axis = 5 students.
Construct rectangles corresponding to the above continuous frequency distribution table.
The required histogram is shown in the adjoining figure.

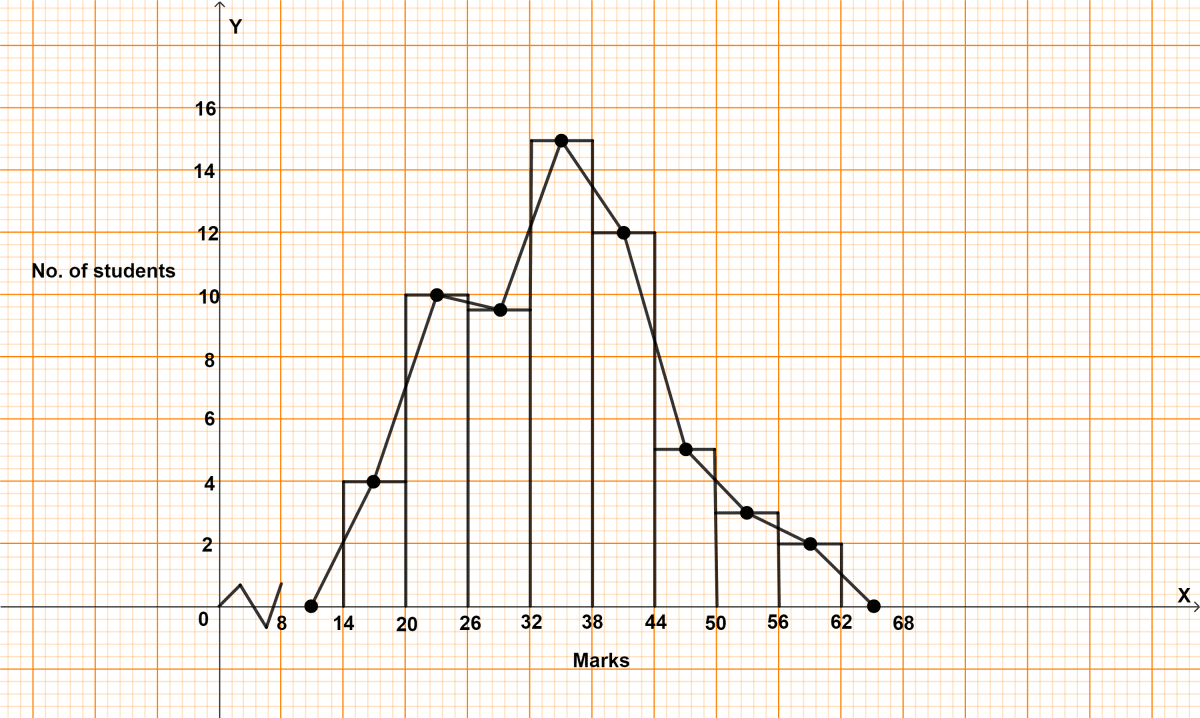
In a class of 60 students, the marks obtained in a surprise test were as under :
| Marks | No. of students |
|---|---|
| 14 - 20 | 4 |
| 20 - 26 | 10 |
| 26 - 32 | 9 |
| 32 - 38 | 15 |
| 38 - 44 | 12 |
| 44 - 50 | 5 |
| 50 - 56 | 3 |
| 56 - 62 | 2 |
Represent the above data by a histogram and a frequency polygon.
Answer
Steps of construction of histogram :
Since, the scale on x-axis starts at 8, a break (kink) is shown near the origin on x-axis to indicate that the graph is drawn to scale beginning at 8.
Take 1 cm along x-axis = 10 marks.
Take 1 cm along y-axis = 5 students.
Construct rectangles corresponding to the above continuous frequency distribution table.
The required histogram is shown in the adjoining figure.
Steps of construction of frequency polygon :
Mark the mid-points of upper bases of rectangles of the histogram.
Join the consecutive mid-points by line segments.
Join the first end point with the mid-point of class 8 - 14 with zero frequency, and join the other end point with the mid-point of class 62 - 68 wirh zero frequency.
The required frequency polygon is shown by thick line segments in the diagram.
Construct a combined histogram and frequency polygon for the following distribution:
| Classes | Frequency |
|---|---|
| 91 - 100 | 16 |
| 101 - 110 | 28 |
| 111 - 120 | 44 |
| 121 - 130 | 20 |
| 131 - 140 | 32 |
| 141 - 150 | 12 |
| 151 - 160 | 4 |
Answer
The following frequency distribution is discontinuous, to convert it into continuous frequency distribution,
Adjustment factor = (Lower limit of one class - Upper limit of previous class) / 2
=
= 0.5
Subtract the adjustment factor (0.5) from all the lower limits and add the adjustment factor (0.5) to all the upper limits.
Continuous frequency distribution for given data is :
| Classes before adjustment | Classes after adjustment | Class mark | Frequency |
|---|---|---|---|
| 91 - 100 | 90.5 - 100.5 | 95.5 | 16 |
| 101 - 110 | 100.5 - 110.5 | 105.5 | 28 |
| 111 - 120 | 110.5 - 120.5 | 115.5 | 44 |
| 121 - 130 | 120.5 - 130.5 | 125.5 | 20 |
| 131 - 140 | 130.5 - 140.5 | 135.5 | 32 |
| 141 - 150 | 140.5 - 150.5 | 145.5 | 12 |
| 151 - 160 | 150.5 - 160.5 | 155.5 | 4 |
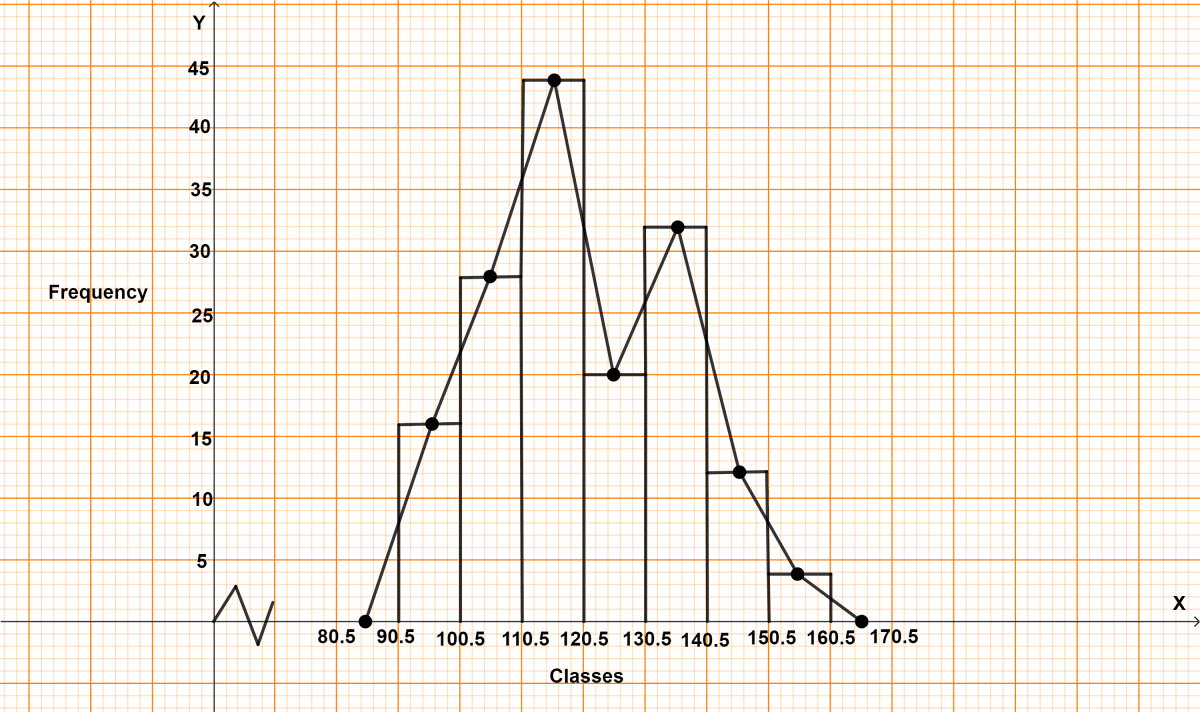
Steps of construction of histogram :
Since, the scale on x-axis starts at 80.5, a break (kink) is shown near the origin on x-axis to indicate that the graph is drawn to scale beginning at 80.5
Take 1 cm along x-axis = 10 units.
Take 1 cm along y-axis = 5 units.
Construct rectangles corresponding to the above continuous frequency distribution table.
The required histogram is shown in the adjoining figure.
Steps of construction of frequency polygon :
Mark the mid-points of upper bases of rectangles of the histogram.
Join the consecutive mid-points by line segments.
Join the first end point with the mid-point of class 80.5 - 90.5 with zero frequency, and join the other end point with the mid-point of class 160.5 - 170.5 with zero frequency.
The required frequency polygon is shown by thick line segments in the diagram.
The Water bills (in rupees) of 40 houses in a locality are given below :
78 87 81 52 59 65 101 108 115 95
98 65 62 121 128 63 76 84 89 91
65 101 95 81 87 105 129 92 75 105
78 72 107 116 127 100 80 82 61 118
Form a frequency distribution table with a class size of 10. Also represent the above data with a histogram and frequency polygon.
Answer
From data,
Least term = 52 and Greatest term = 129.
Range = Greatest term - Least term = 129 – 52 = 77.
Construct a frequency distribution table:
| Class interval | Class mark | Tally numbers | Frequency |
|---|---|---|---|
| 50 - 60 | 55 | II | 2 |
| 60 - 70 | 65 | 6 | |
| 70 - 80 | 75 | 5 | |
| 80 - 90 | 85 | 8 | |
| 90 - 100 | 95 | 5 | |
| 100 - 110 | 105 | 7 | |
| 110 - 120 | 115 | III | 3 |
| 120 - 130 | 125 | IIII | 4 |
| Total | 40 |
Steps of construction of histogram :
Since, the scale on x-axis starts at 40, a break (kink) is shown near the origin on x-axis to indicate that the graph is drawn to scale beginning at 40.
Take 1 cm along x-axis = 10 units.
Take 1 cm along y-axis = 2 units.
Construct rectangles corresponding to the above continuous frequency distribution table.
The required histogram is shown in the adjoining figure.
Steps of construction of frequency polygon :
Mark the mid-points of upper bases of rectangles of the histogram.
Join the consecutive mid-points by line segments.
Join the first end point with the mid-point of class 40 - 50 with zero frequency, and join the other end point with the mid-point of class 130 - 140 with zero frequency.
The required frequency polygon is shown by thick line segments in the diagram.

The data given below represent the marks obtained by 35 students:
21 26 21 20 23 24 22 19 24
26 25 23 26 29 21 24 19 25
26 25 22 23 23 27 26 24 25
30 25 23 28 28 24 28 28
Taking class intervals 19 - 20, 21 - 22 etc., make a frequency distribution for the above data.
Construct a combined histogram and frequency polygon for the distribution.
Answer
From above data :
Least mark = 19
Greatest marks = 30
Range = 30 – 19 = 11.
Given,
We need to take class intervals as 19 - 20, 21 - 22 etc.
The following frequency distribution is discontinuous, to convert it into continuous frequency distribution,
Adjustment factor = (Lower limit of one class - Upper limit of previous class) / 2
=
= 0.5
Subtract the adjustment factor (0.5) from all the lower limits and add the adjustment factor (0.5) to all the upper limits.
Continuous frequency distribution for given data is :
| Classes before adjustment | Classes after adjustment | Class mark | Frequency |
|---|---|---|---|
| 19 - 20 | 18.5 - 20.5 | 19.5 | 3 |
| 21 - 22 | 20.5 - 22.5 | 21.5 | 5 |
| 23 - 24 | 22.5 - 24.5 | 23.5 | 10 |
| 25 - 26 | 24.5 - 26.5 | 25.5 | 10 |
| 27 - 28 | 26.5 - 28.5 | 27.5 | 5 |
| 29 - 30 | 28.5 - 30.5 | 29.5 | 2 |
Steps of construction of histogram :
Since, the scale on x-axis starts at 16.5, a break (kink) is shown near the origin on x-axis to indicate that the graph is drawn to scale beginning at 16.5.
Take 2 cm along x-axis = 2 units.
Take 1 cm along y-axis = 2 units.
Construct rectangles corresponding to the above continuous frequency distribution table.
The required histogram is shown in the adjoining figure.
Steps of construction of frequency polygon :
Mark the mid-points of upper bases of rectangles of the histogram.
Join the consecutive mid-points by line segments.
Join the first end point with the mid-point of class 16.5 - 18.5 with zero frequency, and join the other end point with the mid-point of class 30.5 - 32.5 with zero frequency.
The required frequency polygon is shown by thick line segments in the diagram.

The given histogram and frequency polygon shows the ages of teachers in a school. Answer the following:

(i) What is the class size of each class?
(ii) What is the class whose class mark is 48?
(iii) What is the class whose frequency is maximum?
(iv) Construct a frequency table for the given distribution.
Answer
(i) From graph,
Class marks of two successive class are 36 and 30.
Class size = 36 - 30 = 6.
Hence, the class size of each class is 6.
(ii) Lower limit of class = Class mark -
= 48 -
= 48 - 3
= 45.
Upper limit of class = Class mark +
= 48 +
= 48 + 3
= 51.
Hence, class whose class mark is 48 is 45 - 51.
(iii) From table,
Class with class mark = 54 has greatest frequency.
Lower limit of class = Class mark -
= 54 -
= 54 - 3
= 51.
Upper limit of class = Class mark +
= 54 +
= 54 + 3
= 57.
Hence, class 51 - 57 has highest frequency.
(iv) Frequency table for the given distribution :
| Class mark | Class | Frequency |
|---|---|---|
| 30 | 27 - 33 | 4 |
| 36 | 33 - 39 | 12 |
| 42 | 39 - 45 | 18 |
| 48 | 45 - 51 | 6 |
| 54 | 51 - 57 | 20 |
| 60 | 57 - 63 | 8 |