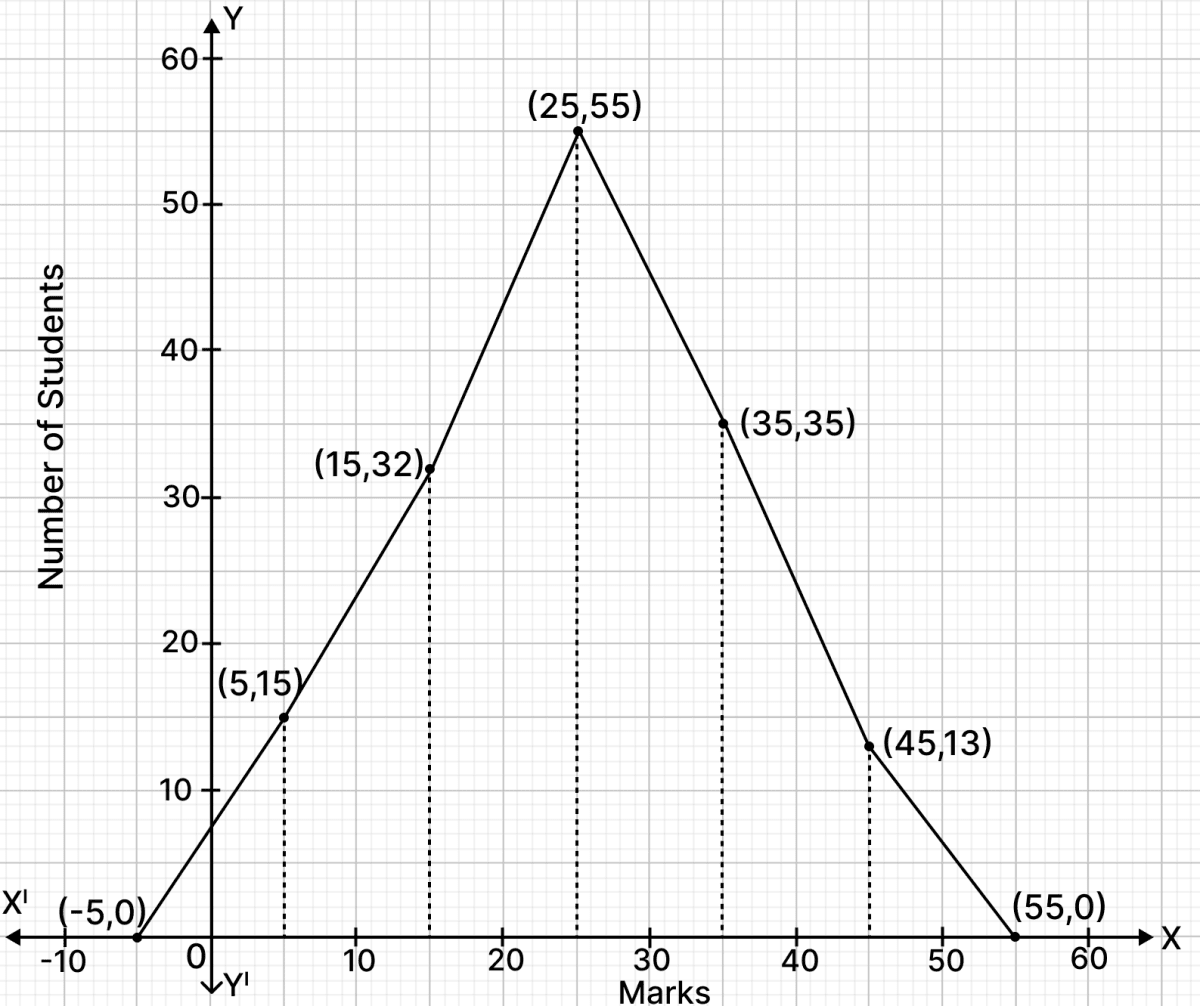
The following table shows the marks obtained by the students of a class in an examination.
| Marks | No. of students |
|---|---|
| 0 - 10 | 15 |
| 10 - 20 | 32 |
| 20 - 30 | 55 |
| 30 - 40 | 35 |
| 40 - 50 | 13 |
Draw a frequency polygon.
Answer
Frequency distribution table :
| Marks | Class mark | Number of students (Frequency) |
|---|---|---|
| 0 - 10 | 5 | 15 |
| 10 - 20 | 15 | 32 |
| 20 - 30 | 25 | 55 |
| 30 - 40 | 35 | 35 |
| 40 - 50 | 45 | 13 |
Steps to draw frequency polygon :
Take 2 cm along x-axis = 10 marks.
Take 2 cm along y-axis = 10 students.
Find the mid-point of class intervals.
Find points corresponding to given frequencies of classes and the mid-points of class-intervals, and plot them.
Join consecutive points by line segments.
Join first end point with mid-point of class (-10) - 0 with zero frequency and join the other end with mid-point of class 50 - 60 with zero frequency.
The required frequency polygon is shown below:
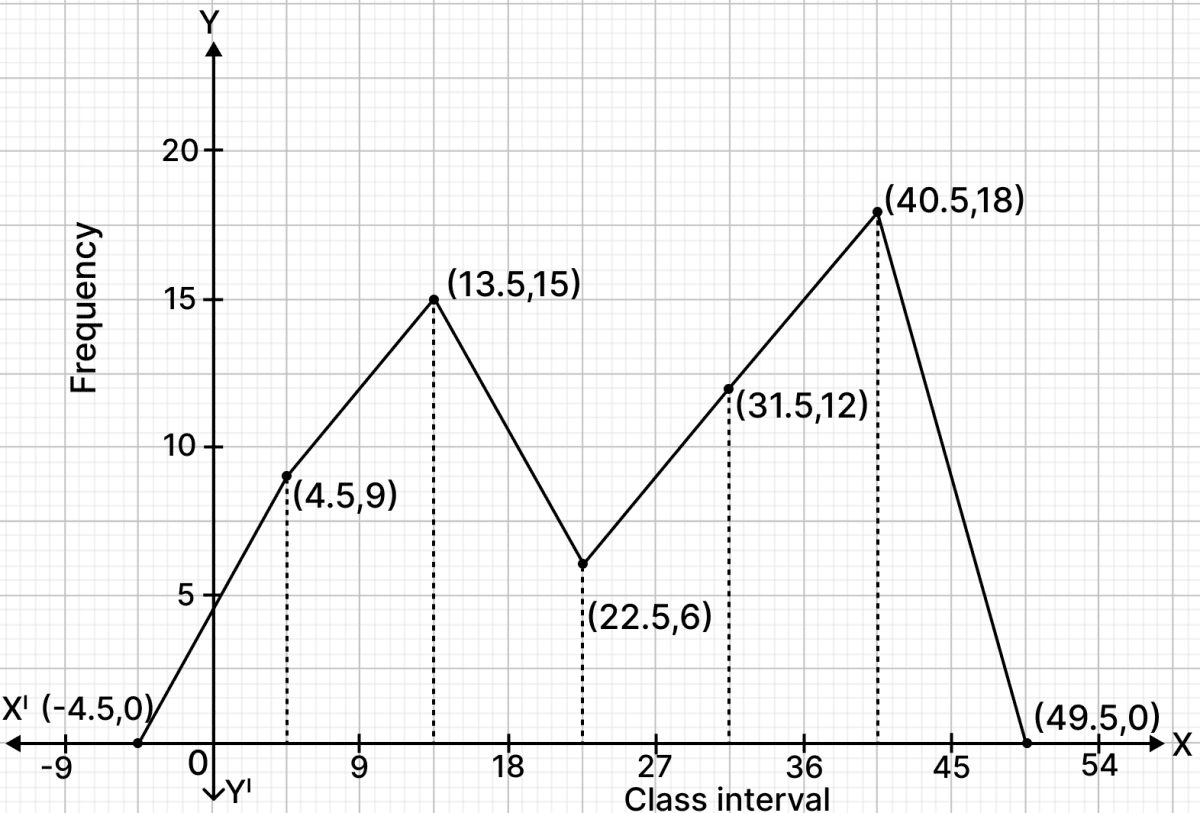
Draw a frequency polygon to represent the following data:
| Class-interval | Frequency |
|---|---|
| 0 - 9 | 9 |
| 9 - 18 | 15 |
| 18 - 27 | 6 |
| 27 - 36 | 12 |
| 36 - 45 | 18 |
Answer
Frequency distribution table :
| Class - interval | Class mark | Frequency |
|---|---|---|
| 0 - 9 | 4.5 | 9 |
| 9 - 18 | 13.5 | 15 |
| 18 - 27 | 22.5 | 6 |
| 27 - 36 | 31.5 | 12 |
| 36 - 45 | 40.5 | 18 |
Steps to draw frequency polygon :
Take 2 cm along x-axis = 9 units.
Take 2 cm along y-axis = 5 units.
Find the mid-point of class intervals.
Find points corresponding to given frequencies of classes and the mid-points of class-intervals, and plot them.
Join consecutive points by line segments.
Join first end point with mid-point of class (-9) - 0 with zero frequency and join the other end with mid-point of class 45 - 54 with zero frequency.
The required frequency polygon is shown below:
The heights of boys in a school are given below :
| Height (in cm) | Number of boys |
|---|---|
| 140 - 145 | 24 |
| 145 - 150 | 32 |
| 150 - 155 | 16 |
| 155 - 160 | 20 |
| 160 - 165 | 44 |
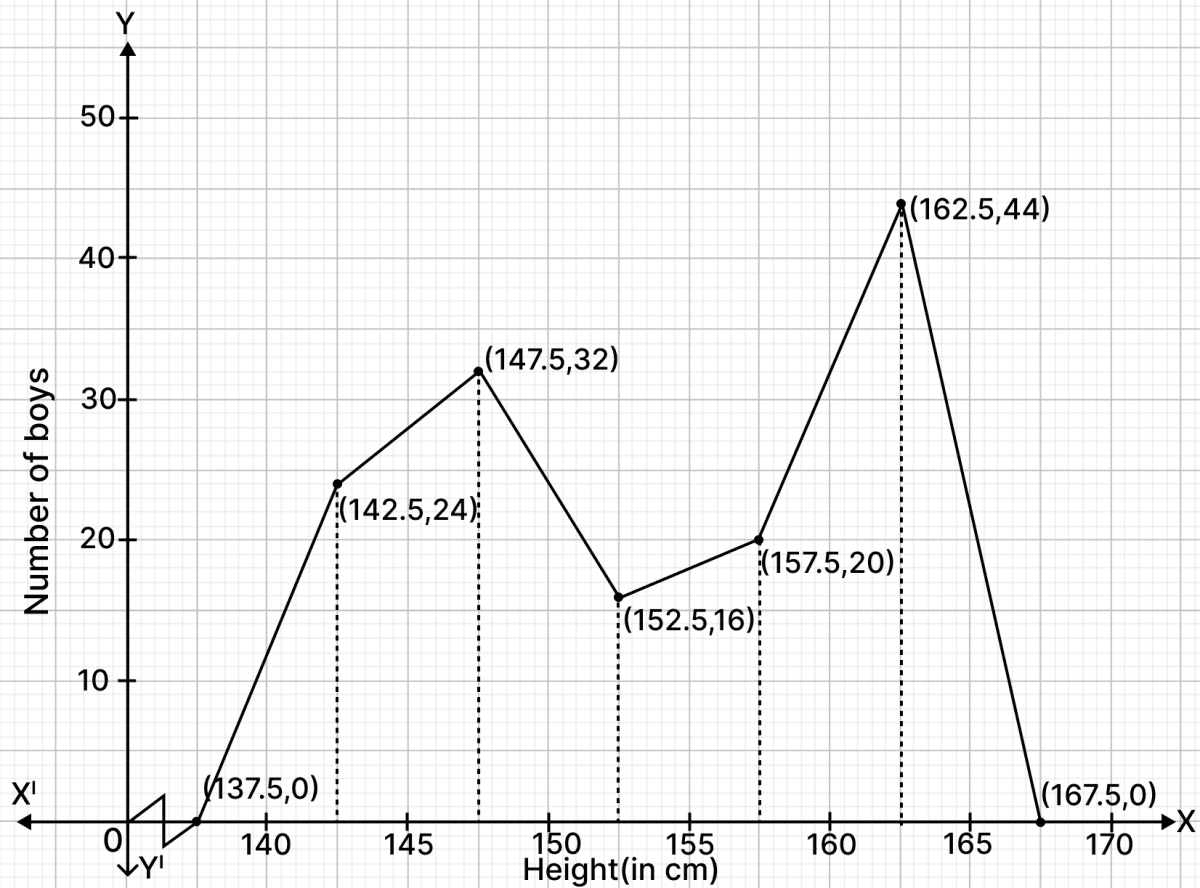
Draw a frequency polygon to represent the above data.
Answer
Frequency distribution table :
| Height (in cm) | Class mark | Frequency |
|---|---|---|
| 140 - 145 | 142.5 | 24 |
| 145 - 150 | 147.5 | 32 |
| 150 - 155 | 152.5 | 16 |
| 155 - 160 | 157.5 | 20 |
| 160 - 165 | 162.5 | 44 |
Steps to draw frequency polygon :
Take 2 cm along x-axis = 5 cm.
Take 2 cm along y-axis = 10 boys.
Find the mid-point of class intervals.
A kink is drawn near x-axis to show that the scale begins at 140.
Find points corresponding to given frequencies of classes and the mid-points of class-intervals, and plot them.
Join consecutive points by line segments.
Join first end point with mid-point of class 135 - 140 with zero frequency and join the other end with mid-point of class 165 - 170 with zero frequency.
The required frequency polygon is shown below :
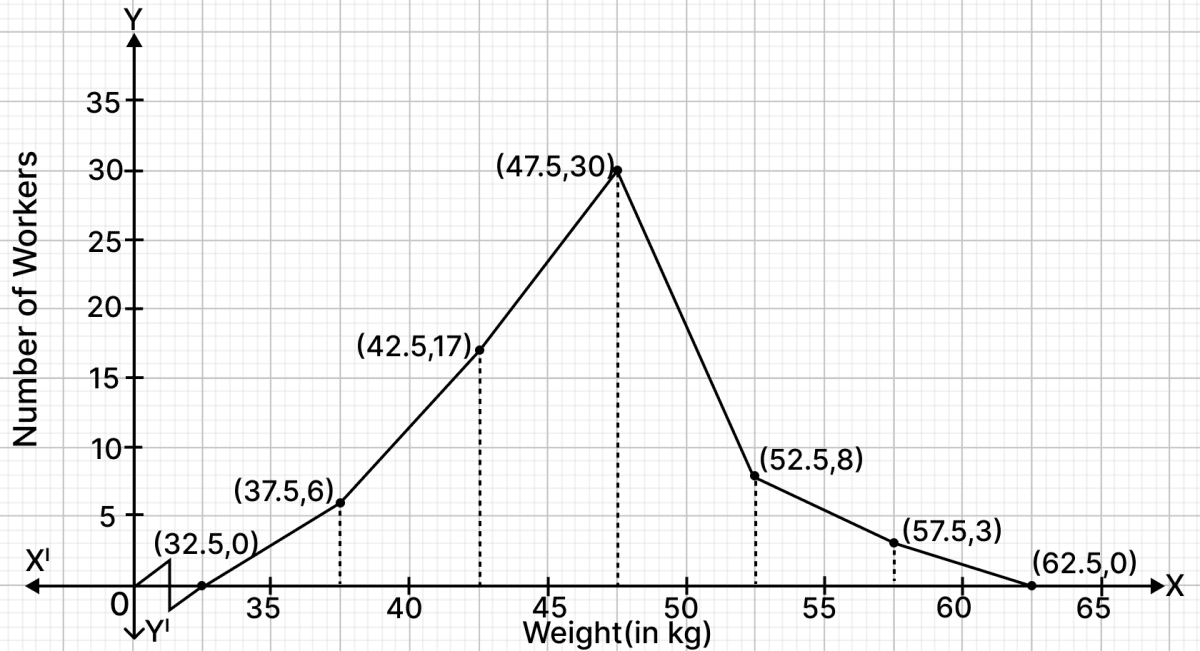
Draw a frequency polygon to represent the following data :
| Weight (in kg) | No. of workers |
|---|---|
| 35 - 40 | 6 |
| 40 - 45 | 17 |
| 45 - 50 | 30 |
| 50 - 55 | 8 |
| 55 - 60 | 3 |
Answer
Frequency distribution table :
| Weight (in kg) | Class mark | Frequency |
|---|---|---|
| 35 - 40 | 37.5 | 6 |
| 40 - 45 | 42.5 | 17 |
| 45 - 50 | 47.5 | 30 |
| 50 - 55 | 52.5 | 8 |
| 55 - 60 | 57.5 | 3 |
Steps to draw frequency polygon :
Take 2 cm along x-axis = 5 kg.
Take 2 cm along y-axis = 5 workers.
Find the mid-point of class intervals.
A kink is drawn near x-axis to show that the scale begins at 35.
Find points corresponding to given frequencies of classes and the mid-points of class-intervals, and plot them.
Join consecutive points by line segments.
Join first end point with mid-point of class 30 - 35 with zero frequency and join the other end with mid-point of class 60 - 65 with zero frequency.
The required frequency polygon is shown below :
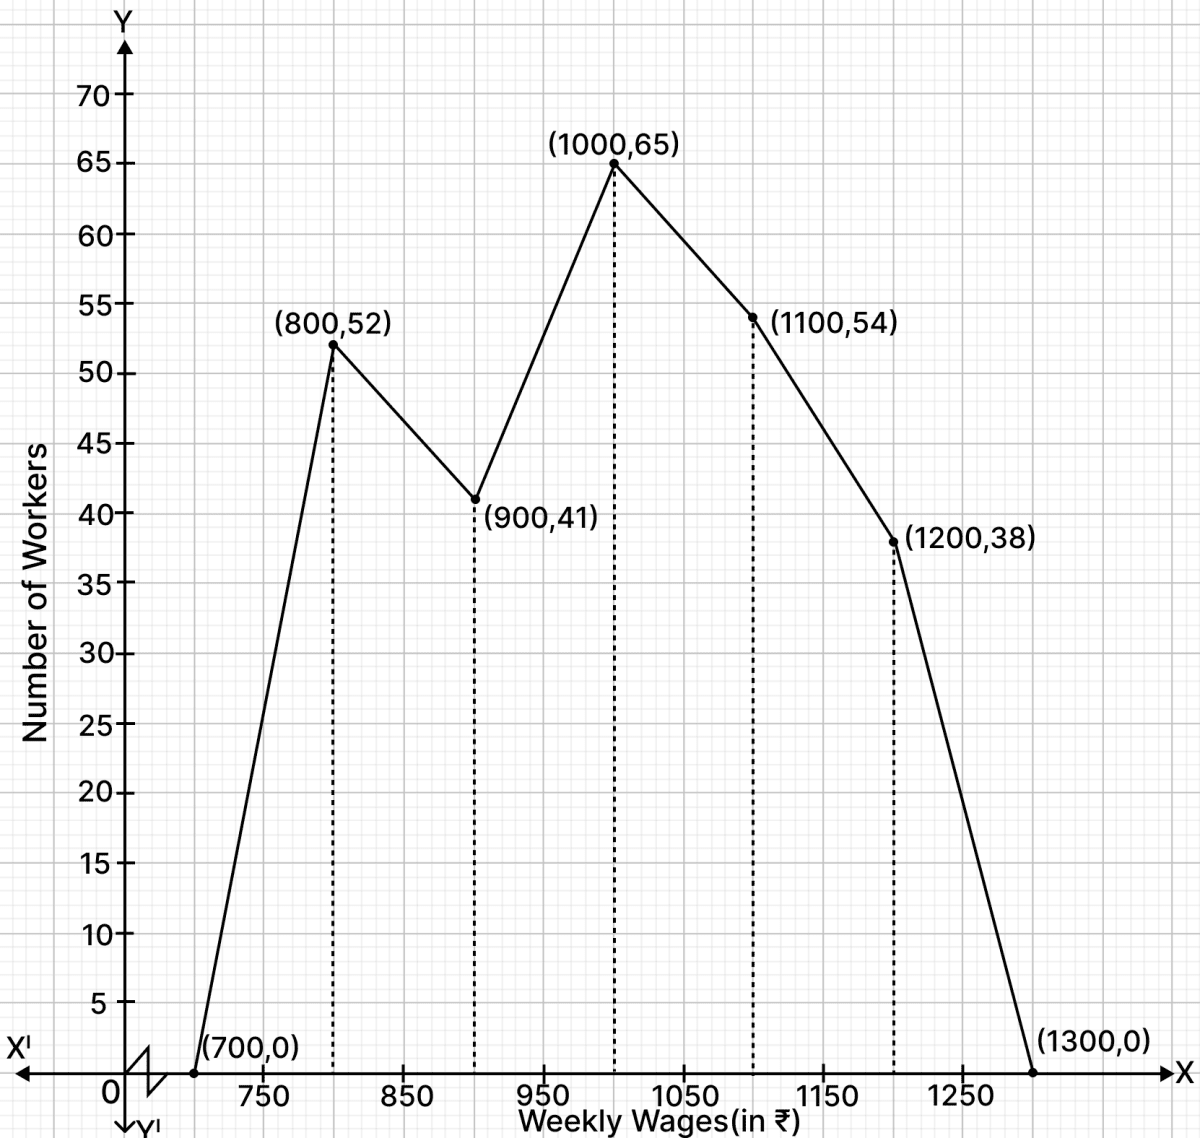
Draw a frequency polygon to represent the following data:
| Weekly wages (in ₹) | No. of workers |
|---|---|
| 750 - 850 | 52 |
| 850 - 950 | 41 |
| 950 - 1050 | 65 |
| 1050 - 1150 | 54 |
| 1150 - 1250 | 38 |
Answer
Frequency distribution table :
| Weekly wages (in ₹) | Class mark | Frequency |
|---|---|---|
| 750 - 850 | 800 | 52 |
| 850 - 950 | 900 | 41 |
| 950 - 1050 | 1000 | 65 |
| 1050 - 1150 | 1100 | 54 |
| 1150 - 1250 | 1200 | 38 |
Steps to draw frequency polygon :
Take 2 cm along x-axis = ₹ 100.
Take 1 cm along y-axis = 5 workers.
Find the mid-point of class intervals.
A kink is drawn near x-axis to show that the scale begins at 750.
Find points corresponding to given frequencies of classes and the mid-points of class-intervals, and plot them.
Join consecutive points by line segments.
Join first end point with mid-point of class 650 - 750 with zero frequency and join the other end with mid-point of class 1250 - 1350 with zero frequency.
The required frequency polygon is shown below:
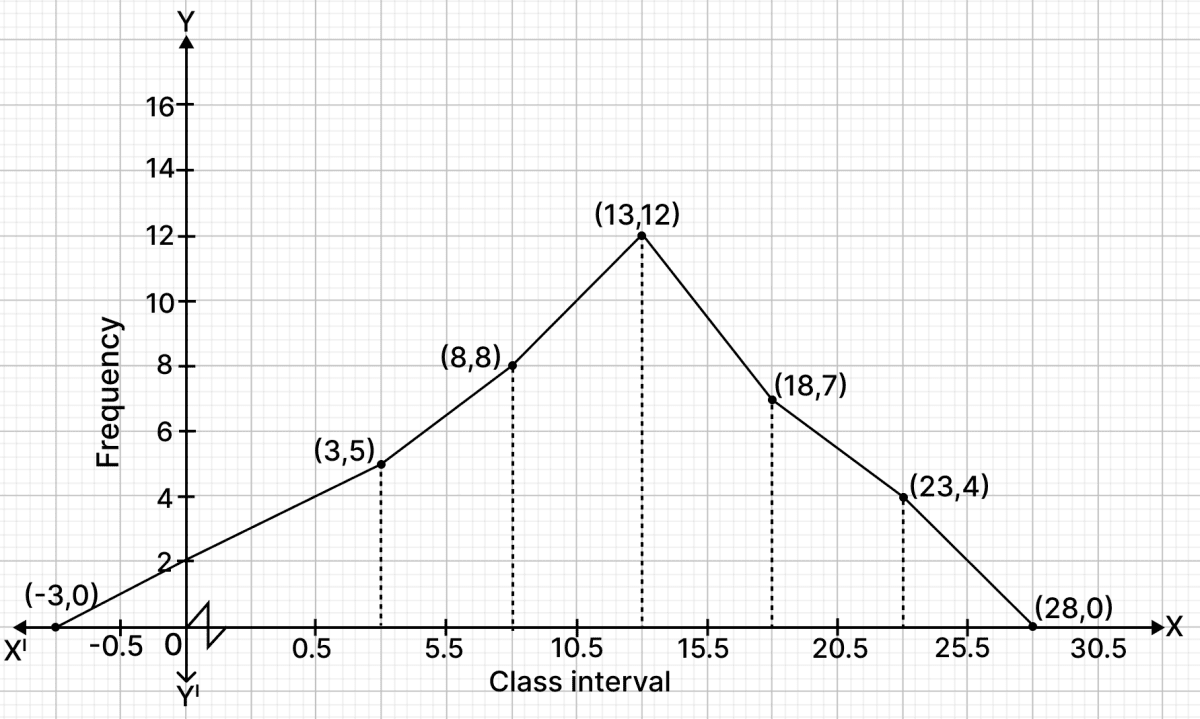
Construct a frequency polygon from the following data :
| Class-interval | Frequency |
|---|---|
| 1 - 5 | 5 |
| 6 - 10 | 8 |
| 11 - 15 | 12 |
| 16 - 20 | 7 |
| 21 - 25 | 4 |
Answer
The following frequency distribution table is discontinuous. Convert it into continuous frequency distribution.
Adjustment factor =
= = 0.5.
Subtract the adjustment factor (0.5) from all the lower limits and add the adjustment factor (0.5) to all the upper limits.
Continuous frequency distribution table :
| Class-interval | Class mark | Frequency |
|---|---|---|
| 0.5 - 5.5 | 3 | 5 |
| 5.5 - 10.5 | 8 | 8 |
| 10.5 - 15.5 | 13 | 12 |
| 15.5 - 20.5 | 18 | 7 |
| 20.5 - 25.5 | 23 | 4 |
Steps to draw frequency polygon :
Take 2 cm along x-axis = 5 units.
Take 2 cm along y-axis = 2 units.
Find the mid-point of class intervals.
A kink is drawn near x-axis to show that the scale begins at 0.5.
Find points corresponding to given frequencies of classes and the mid-points of class-intervals, and plot them.
Join consecutive points by line segments.
Join first end point with mid-point of class -5.5 - 0.5 with zero frequency and join the other end with mid-point of class 25.5 - 30.5 with zero frequency.
The required frequency polygon is shown below: