
Mathematics
Assertion (A) : Class size of the following class intervals is 10.
1 - 10, 11 - 20, 21 - 30, etc.
Reason (R) : The difference between the upper limit and lower limit is the class size.
Both A and R are correct, and R is the correct explanation for A.
Both A and R are correct, and R is not the correct explanation for A.
A is true, but R is false.
A is false, but R is true.
Statistics
2 Likes
Answer
Given, the class intervals -
1 - 10, 11 - 20, 21 - 30, etc.
As we know that class size is the difference between upper and lower limits.
Class size = Upper limit - Lower limit
So, reason (R) is true.
1st class interval: 1 - 10
Class size = 10 - 1 = 9
2nd class interval: 11 - 20
Class size = 20 - 11 = 9
So, assertion (A) is false.
∴ A is false, but R is true.
Hence, option 4 is the correct option.
Answered By
2 Likes
Related Questions
Consider the following class intervals of a grouped data :
Class interval 10-25 25-40 ------- 55-70 Statement 1: Class marks of the 3rd class intervals is 46.5.
Statement 2: If the class mark of 2nd interval is 77.5, the interval is 60 - 85.
Which of the following options is correct?
Both the statements are true.
Both the statements are false.
Statement 1 is true, and statement 2 is false.
Statement 1 is false, and statement 2 is true.
Assertion (A) : If in a pie chart representing the number of students of opting for different streams in college admission out of a total admission of 3300, the central angle for the sector representing mathematics is 48°, then the number of students who opted for mathematics is 440.
Reason (R) : Central angle for sector (Component) =
Both A and R are correct, and R is the correct explanation for A.
Both A and R are correct, and R is not the correct explanation for A.
A is true, but R is false.
A is false, but R is true.
Assertion (A) : The given bar graph shows the heights of six mountain peaks.
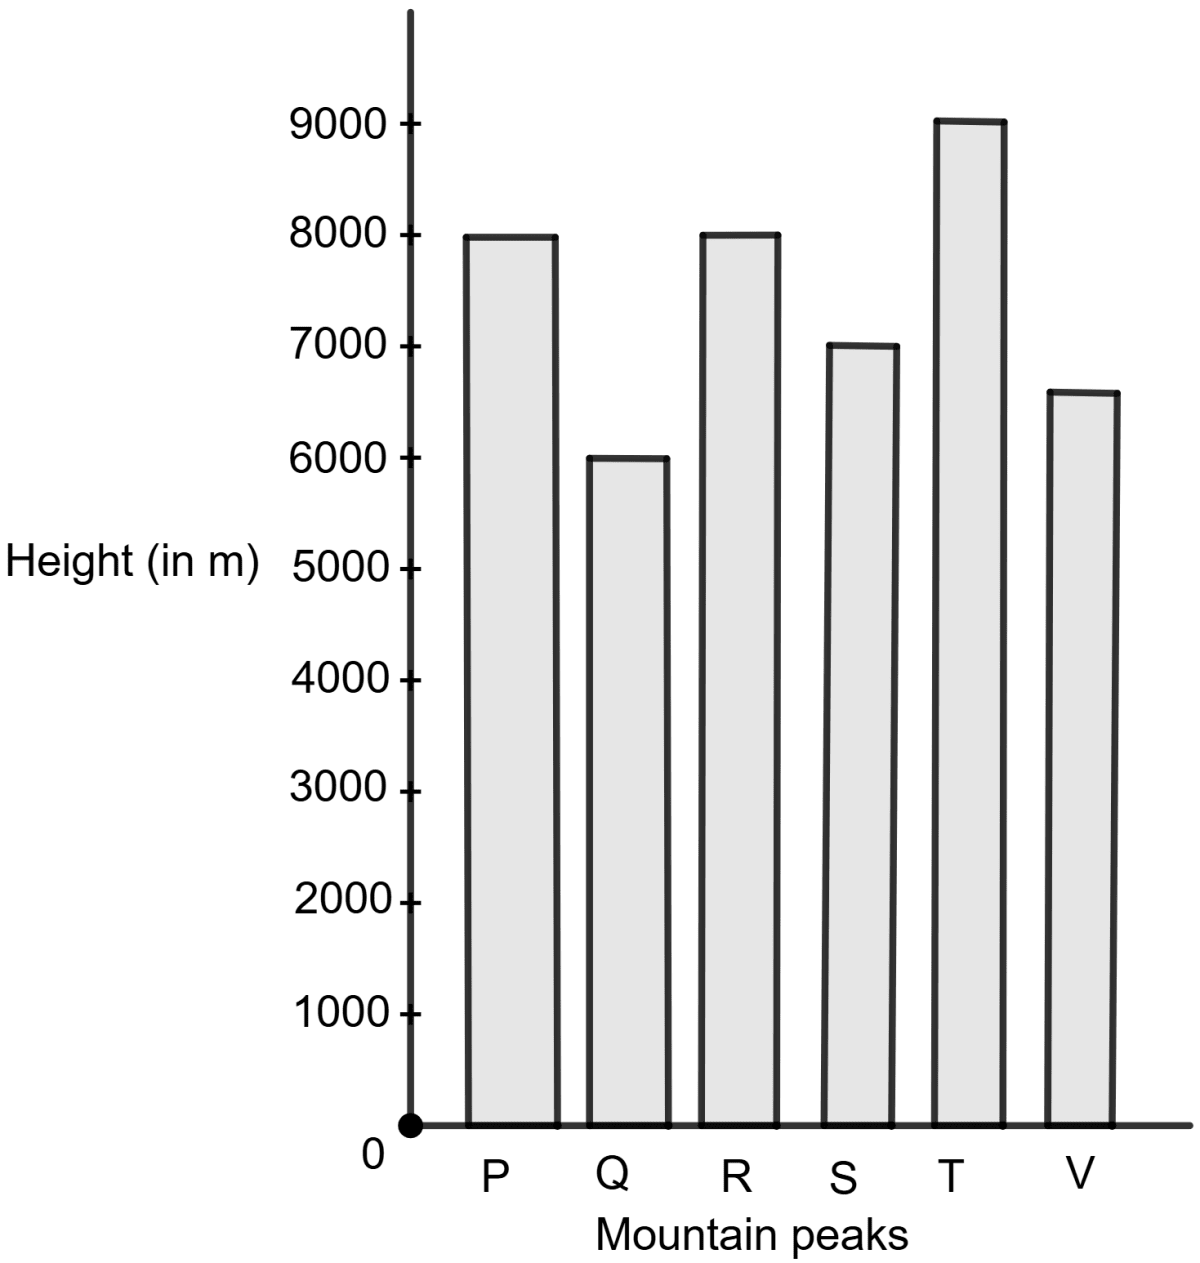
The ratio of height of the highest to the lowest peak is 3 : 2.
Reason (R) : The space between consecutive bars may be of any suitable value, but the spaces between all the consecutive bars must the same.
Both A and R are correct, and R is the correct explanation for A.
Both A and R are correct, and R is not the correct explanation for A.
A is true, but R is false.
A is false, but R is true.
Assertion (A) : The distribution of land in Pacific Housing Society is shown in the pie chart below. The total land area for project is 144000 m2.
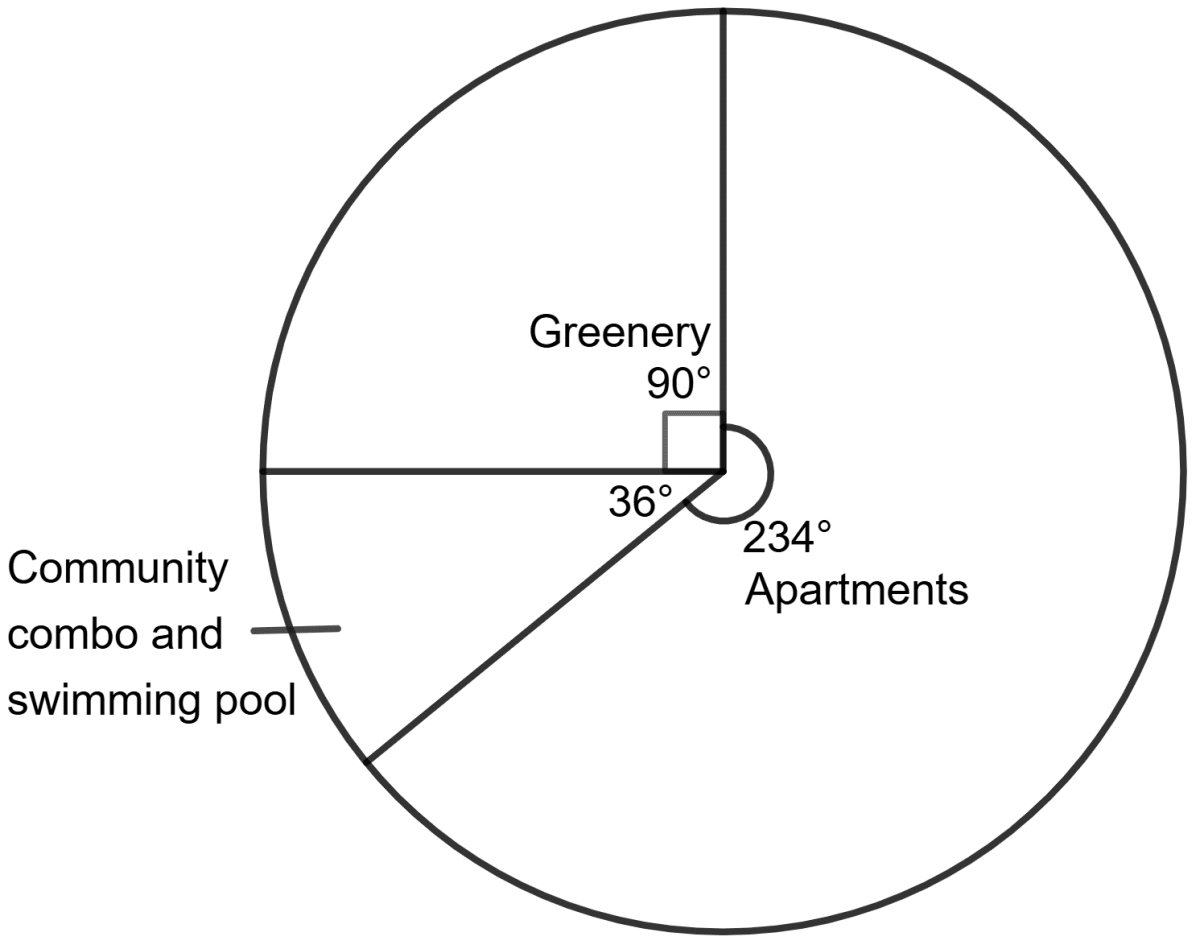
The ratio of the area kept open to the ratio of the area for apartment construction is 5 : 13.
Reason (R) : In a pie chart, the central angle of a sector suspended by its arc is proportional to the value it represents.
Both A and R are correct, and R is the correct explanation for A.
Both A and R are correct, and R is not the correct explanation for A.
A is true, but R is false.
A is false, but R is true.