
Mathematics
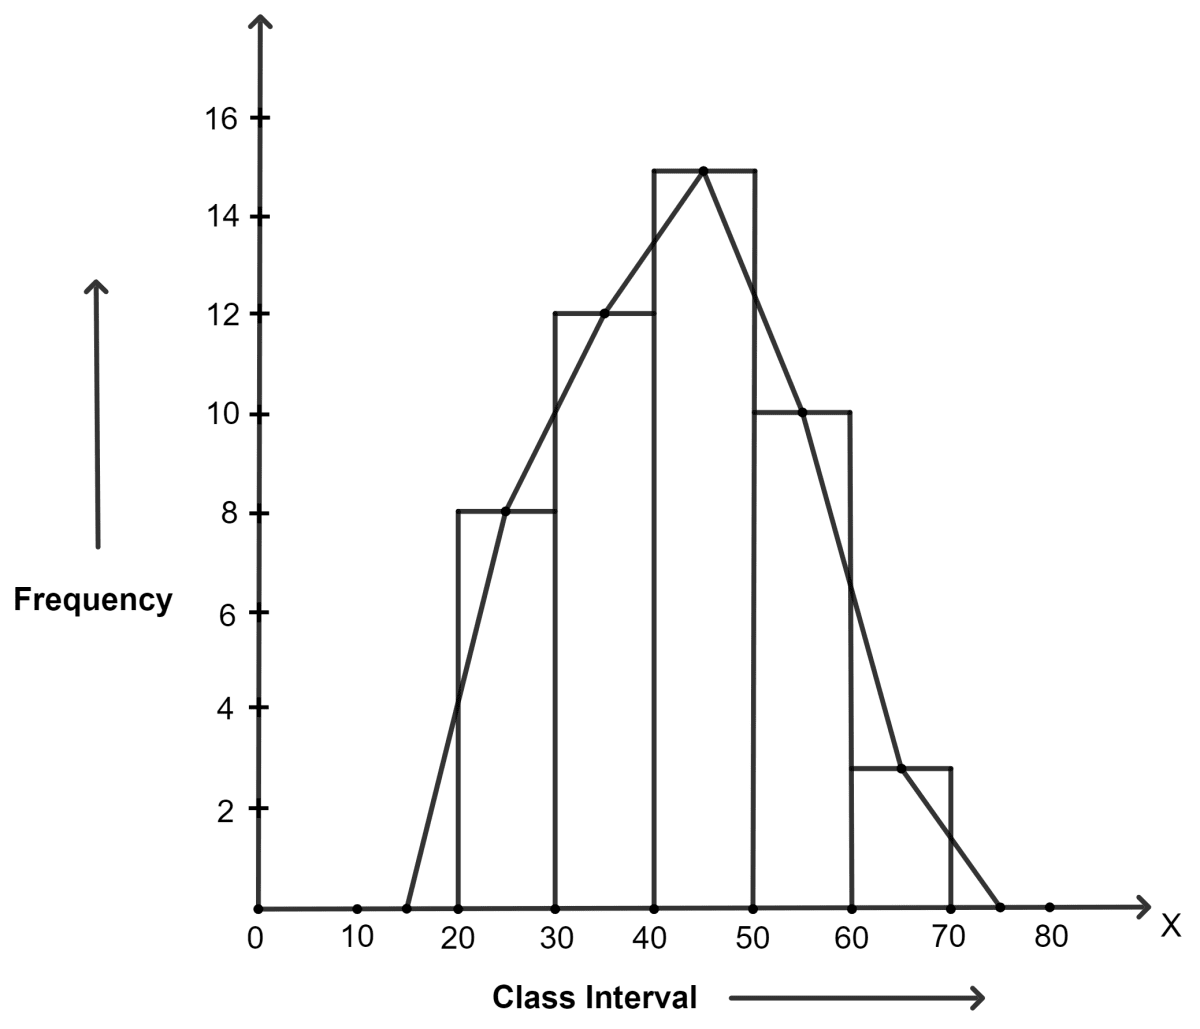
Construct a combined histogram and frequency polygon for the following frequency distribution :
| Class-intervals | 20 - 30 | 30 - 40 | 40 - 50 | 50 - 60 | 60 - 70 |
|---|---|---|---|---|---|
| Frequency | 8 | 12 | 15 | 10 | 3 |
Statistics
40 Likes
Answer
Steps:
Draw a histogram for the given data.
Mark the mid-point at the top of each rectangle of the histogram drawn.
Also, mark the mid-point of the immediately lower class-interval (in the given question, the immediately lower class-interval is 10 - 20) and mid-point of the immediately higher class-interval (in the given question the immediate upper class-interval is 70 - 80).
Join the consecutive mid-points marked by straight lines to obtain the required frequency polygon.
Answered By
22 Likes
Related Questions
Draw frequency polygons for each of the following frequency distribution :
(a) using histogram
(b) without using histogram.
C.I. 5 - 15 15 - 25 25 - 35 35 - 45 45 - 55 55 - 65 f 8 16 18 14 8 2 Using the class intervals 0-9, 10-19, 20-29, …………… , construct the frequency distribution for :
15, 8, 12, 7, 13, 16, 22, 29, 35, 49, 37 and 48.
Construct the cumulative frequency table for :
Marks 20 - 29 30 - 39 40 - 49 50 - 59 No. of students 18 23 36 42 Srikanth is a class IX Mathematics teacher in Chennai. After a class test, he asks a student to record the marks that all the students obtained. Narayanan scored the least marks 6 in the class and Keerthana scored the highest marks 59 in the class out of 60 marks. He prepares a frequency distribution table using the collected data and draws a histogram as shown below :
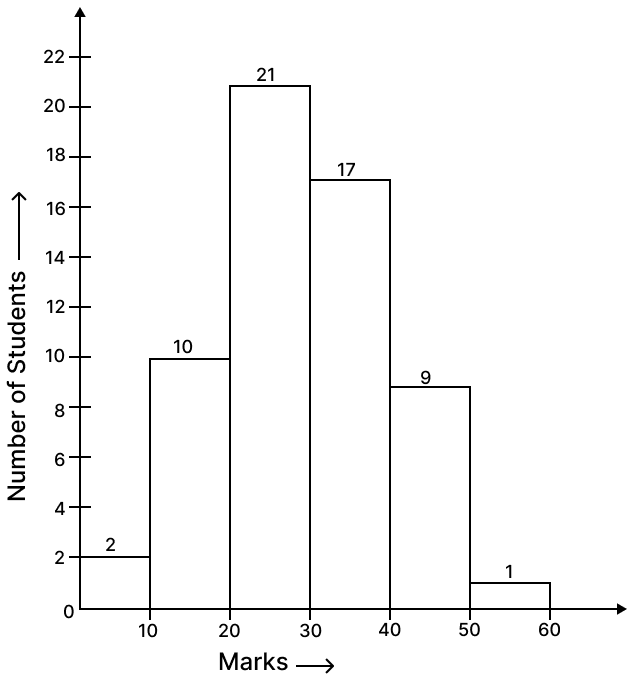
(i) What is the width of each class ?
(ii) What is the total number of students in class IX ?
(iii) How many students scored 50% and above marks ?
(iv) What is the range of the collected data ?