
Physics
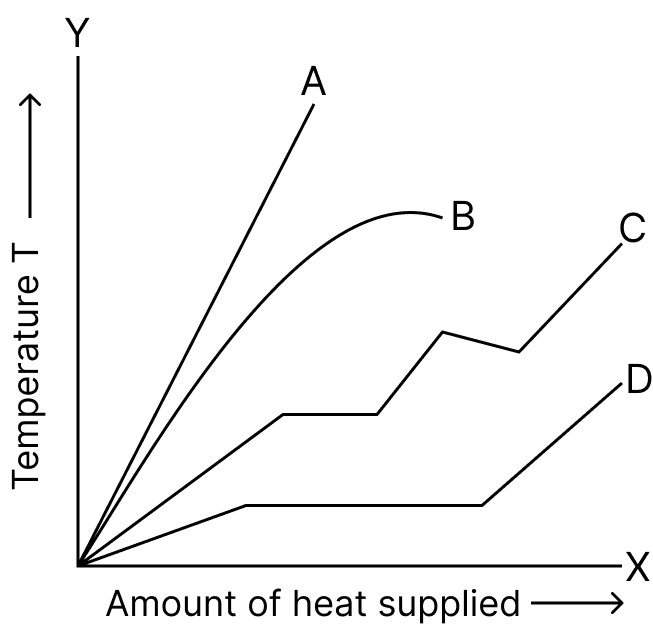
The curve which shows the rise of temperature with the amount of heat supplied for a piece of ice is :
- A
- B
- C
- D
Calorimetry
1 Like
Answer
D
Reason — When heat is supplied to a piece of ice, its temperature does not rise continuously.
- Initially, the temperature remains constant at 0 °C while the ice melts (latent heat of fusion).
- After complete melting, the temperature of water increases until it reaches 100 °C.
- At this point, the temperature again remains constant during boiling (latent heat of vaporization).
Thus, the temperature vs heat graph shows horizontal portions (constant temperature) during phase changes and sloping portions when temperature rises.
Curve D correctly represents this combination of flat and rising segments, matching the actual heating process of ice.
Hence, curve D is correct.
Answered By
3 Likes
Related Questions
Heat energy is …………… during melting and it is …………… during freezing at a constant temperature.
- rejected, absorbed
- rejected, rejected
- absorbed, absorbed
- absorbed, rejected
Heat energy supplied during the melting of a substance is utilised in :
- increasing the kinetic energy of molecules
- decreasing the potential energy of molecules
- increasing the potential energy of molecules
- decreasing the kinetic energy of molecules
Two bodies A and B are of the same material but A has twice the mass of B. Both are heated up to the same temperature. Identify the correct statement ?
- Heat absorbed by A is half of that by B.
- Heat absorbed by A is equal to that by B.
- Heat absorbed by A is twice of that by B.
- Heat absorbed by A is four times that by B.
A large bucket of water at 40 °C and a small cup of water at 80 °C are kept on a table. Which of them has higher heat content ?
- The cup of water.
- The bucket of water.
- Both of them have an equal heat content.
- Cannot be said without knowing the mass of the water in each.