
Mathematics
The daily wages of 160 workers in a building project are given below :
| Wages (in ₹) | No. of workers |
|---|---|
| 130-140 | 48 |
| 140-150 | 34 |
| 150-160 | 26 |
| 160-170 | 32 |
| 170-180 | 20 |
Draw a cumulative frequency curve and use it to estimate :
(i) the median wage
(ii) semi-inter quartile range
(iii) percentage of workers who earn between ₹ 145 and ₹ 165.
Statistics
6 Likes
Answer
Cumulative frequency distribution table :
| Wages (in ₹) | No. of workers | Cumulative frequency |
|---|---|---|
| 130-140 | 48 | 48 |
| 140-150 | 34 | 82 |
| 150-160 | 26 | 108 |
| 160-170 | 32 | 140 |
| 170-180 | 20 | 160 |
Since, n = 160, which is even.
Median = th term = = 80th term.
Steps of construction :
Take 1 cm = ₹ 20 on x-axis.
Take 2 cm = 10 workers on y-axis.
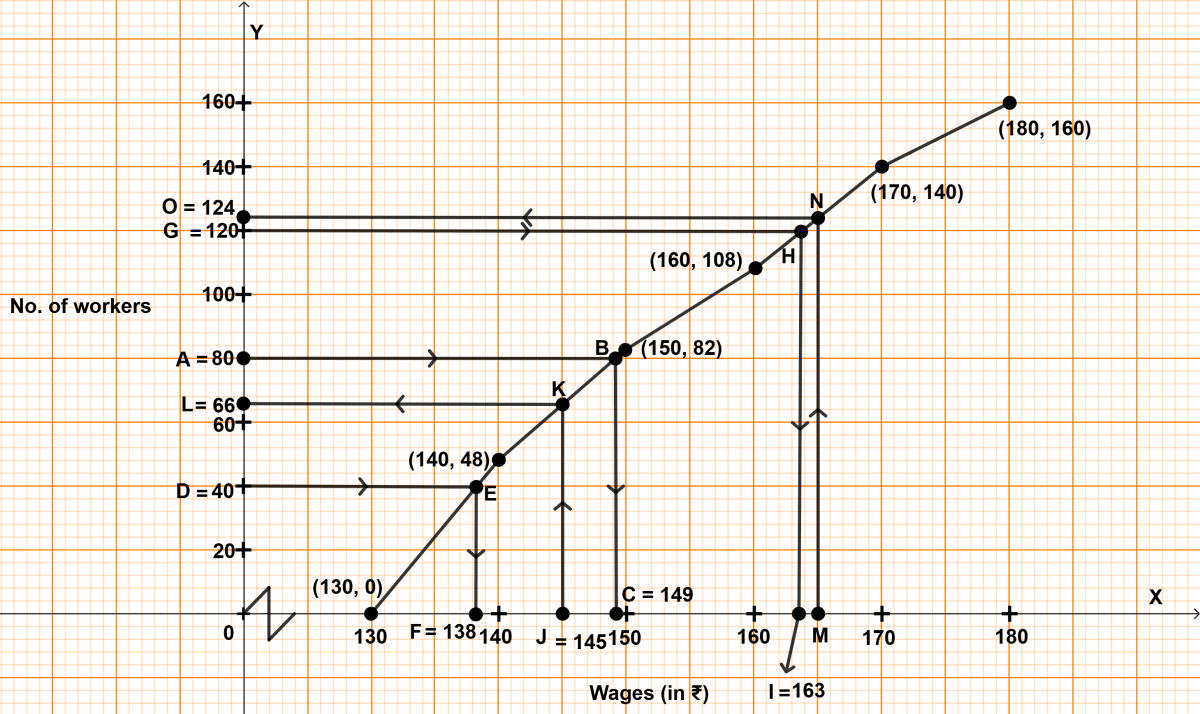
Plot the points (130, 0), (140, 48), (150, 82), (160, 108), (170, 140) and (180, 160).
Join the points by a free hand curve.
Mark point A = 80 on y-axis, from point A draw a horizontal line parallel to x-axis touching the graph at point B, from point B draw a vertical line parallel to y-axis touching x-axis at point C (equal to 149).
By formula,
Lower quartile = th term = = 40th term.
Upper quartile = th term = = 120th term.Mark point D = 40 on y-axis, from point D draw a horizontal line parallel to x-axis touching the graph at point E, from point E draw a vertical line parallel to y-axis touching x-axis at point F (equal to 138).
Mark point G = 120 on y-axis, from point G draw a horizontal line parallel to x-axis touching the graph at point H, from point H draw a vertical line parallel to y-axis touching x-axis at point I (equal to 163).
Inter quartile = Upper quartile - Lower quartile = 163 - 138 = 25.
Semi-inter quartile range = = 12.5Mark point J = 145 on x-axis, from point J draw a vertical line parallel to y-axis touching the graph at point K, from point K draw a horizontal line parallel to x-axis touching y-axis at point L (equal to 66). L represents no. of workers earning less than or equal to ₹ 145.
Mark point M = 165 on x-axis, from point M draw a vertical line parallel to y-axis touching the graph at point N, from point N draw a horizontal line parallel to x-axis touching y-axis at point O (equal to 124). O represents no. of workers earning less than or equal to ₹ 165.
No. of workers who earn between ₹ 145 and ₹ 165 = 124 - 66 = 58.
Percentage of workers who earn between ₹ 145 and ₹ 165
= 36.25%
(i) Hence, median wage = ₹ 149.
(ii) Hence, semi-inter quartile range = 12.5
(iii) Hence, percentage of workers who earn between ₹ 145 and ₹ 165 = 36.25%.
Answered By
5 Likes
Related Questions
If a, c, a2 + b2 and b2 + c2 are in proportion, show that b is mean proportion between a and c.
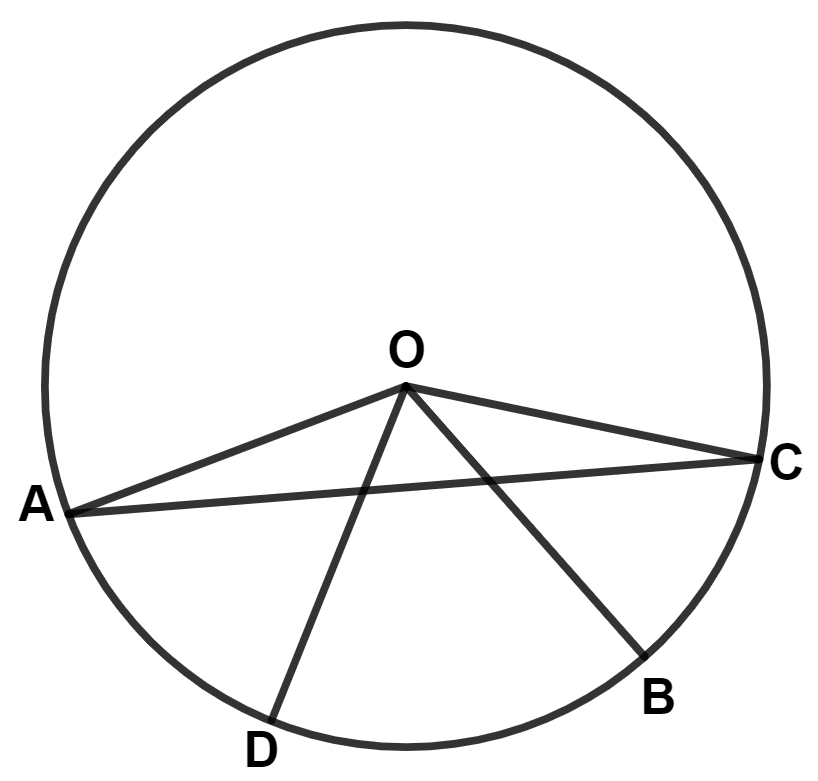
The given figure shows a circle with center O. Points A, D, B and C lie on the circumference of the given circle and angle AOB = 108°. If arc ADB = 2 × arc BC, find :
(i) ∠ACB
(ii) ∠CAB
(iii) ∠ADB
Let matrix A = , find matrix M so that AM = B.
Find the nature of the roots of the quadratic equation 3x2 - 7x + = 0. If real roots exist, find them.