
Mathematics
Draw a bar-graph to represent the following data :
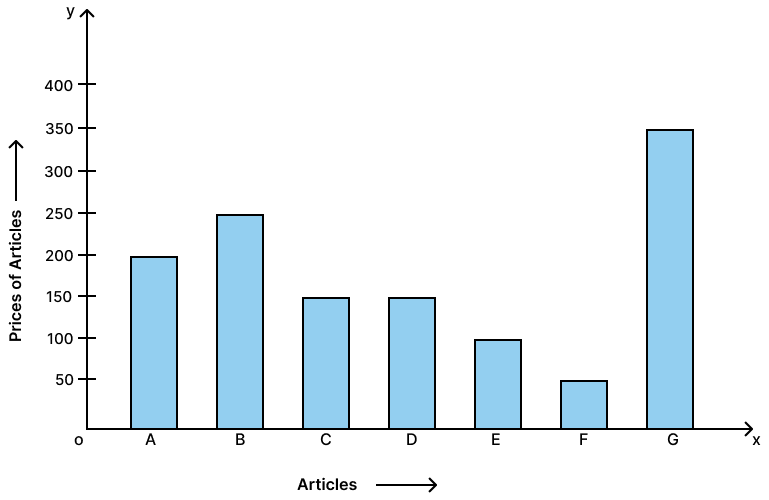
| Articles : | A | B | C | D | E | F | G |
|---|---|---|---|---|---|---|---|
| Price of articles : | 200 | 250 | 150 | 150 | 100 | 50 | 350 |
Statistics
6 Likes
Answer
Steps:
On a graph paper, draw two mutually perpendicular lines OX and OY which intersect each other at point O.
The line OX is taken horizontal and is called the x-axis, whereas the line OY is taken vertical and is called the y-axis.
On the x-axis, starting from O, mark points at equal distances. At these points write the names of the different articles given. In this question, the names are A, B, C, D, E, F and G.
Along y-axis, mark the heights of the bars (rectangles) in proportion to the given data (Prices of articles).
Remember:
(i) The heights of different bars (rectangles) are parallel to y-axis and the mid-points of their bases are on the points marked on the x-axis (step 2).
(ii) The bars may be taken of any suitable width, but widths of all the bars must be the same.
(iii) The space (distance) between consecutive bars may be of any suitable value, but the spaces between all the consecutive bars must be the same.
The required bar graph is as given below:
Answered By
2 Likes
Related Questions
Assertion (A) : The given bar graph shows the heights of six mountain peaks.
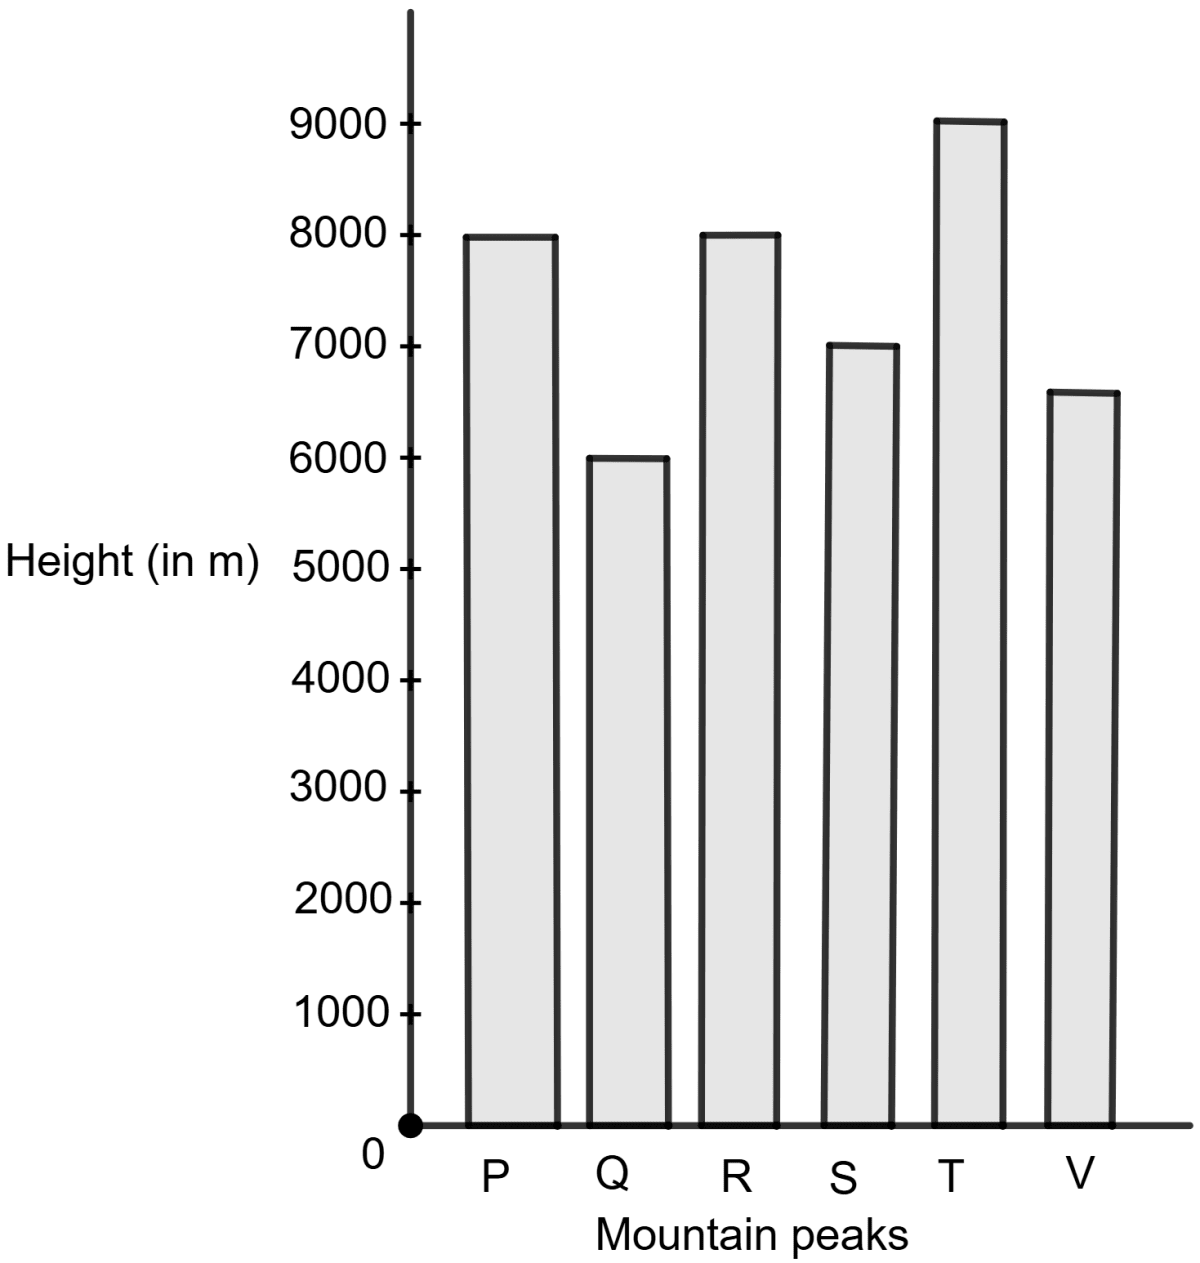
The ratio of height of the highest to the lowest peak is 3 : 2.
Reason (R) : The space between consecutive bars may be of any suitable value, but the spaces between all the consecutive bars must the same.
Both A and R are correct, and R is the correct explanation for A.
Both A and R are correct, and R is not the correct explanation for A.
A is true, but R is false.
A is false, but R is true.
Assertion (A) : The distribution of land in Pacific Housing Society is shown in the pie chart below. The total land area for project is 144000 m2.
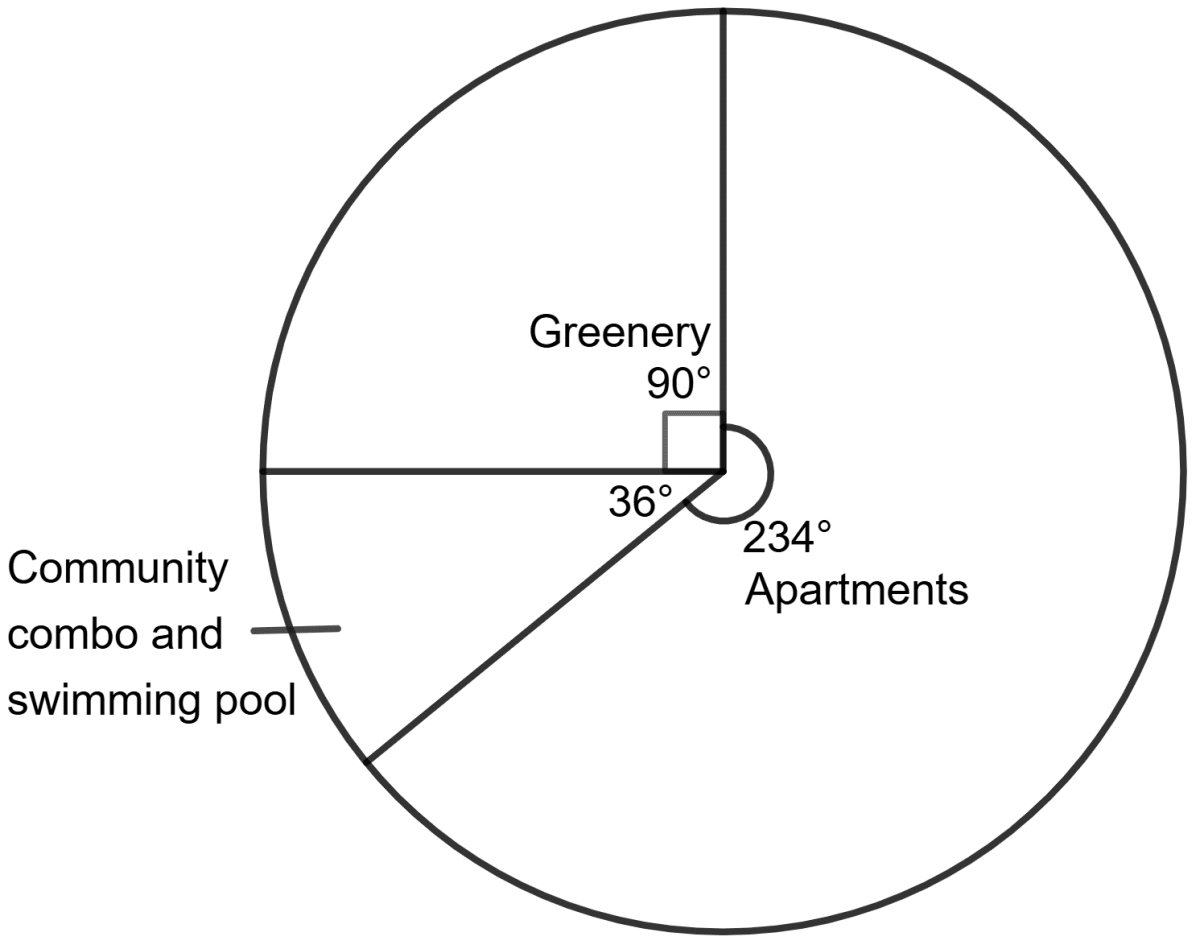
The ratio of the area kept open to the ratio of the area for apartment construction is 5 : 13.
Reason (R) : In a pie chart, the central angle of a sector suspended by its arc is proportional to the value it represents.
Both A and R are correct, and R is the correct explanation for A.
Both A and R are correct, and R is not the correct explanation for A.
A is true, but R is false.
A is false, but R is true.
Study the given graph and then answer the following questions :
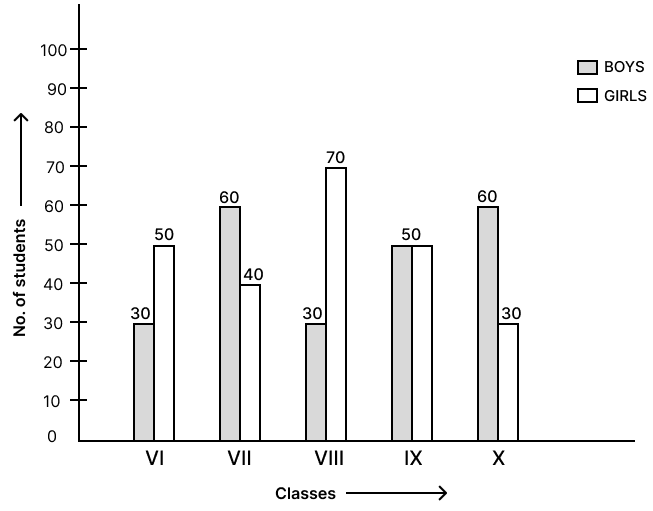
(i) Which classes have the larger number of students ?
(ii) Which class has the equal number of girls and boys ?
(iii) What is the total number of students in class VIII ?
(iv) What is the total number of students (from the class VI to class X) ?
The following table shows the number of students in various classes :
Class VI VII VIII IX X No. of students 360 300 54 150 216 Draw a pie-graph to represent the above data.