Mathematics
The following table shows the number of students in various classes :
| Class | VI | VII | VIII | IX | X |
|---|---|---|---|---|---|
| No. of students | 360 | 300 | 54 | 150 | 216 |
Draw a pie-graph to represent the above data.
Statistics
17 Likes
Answer
Steps:
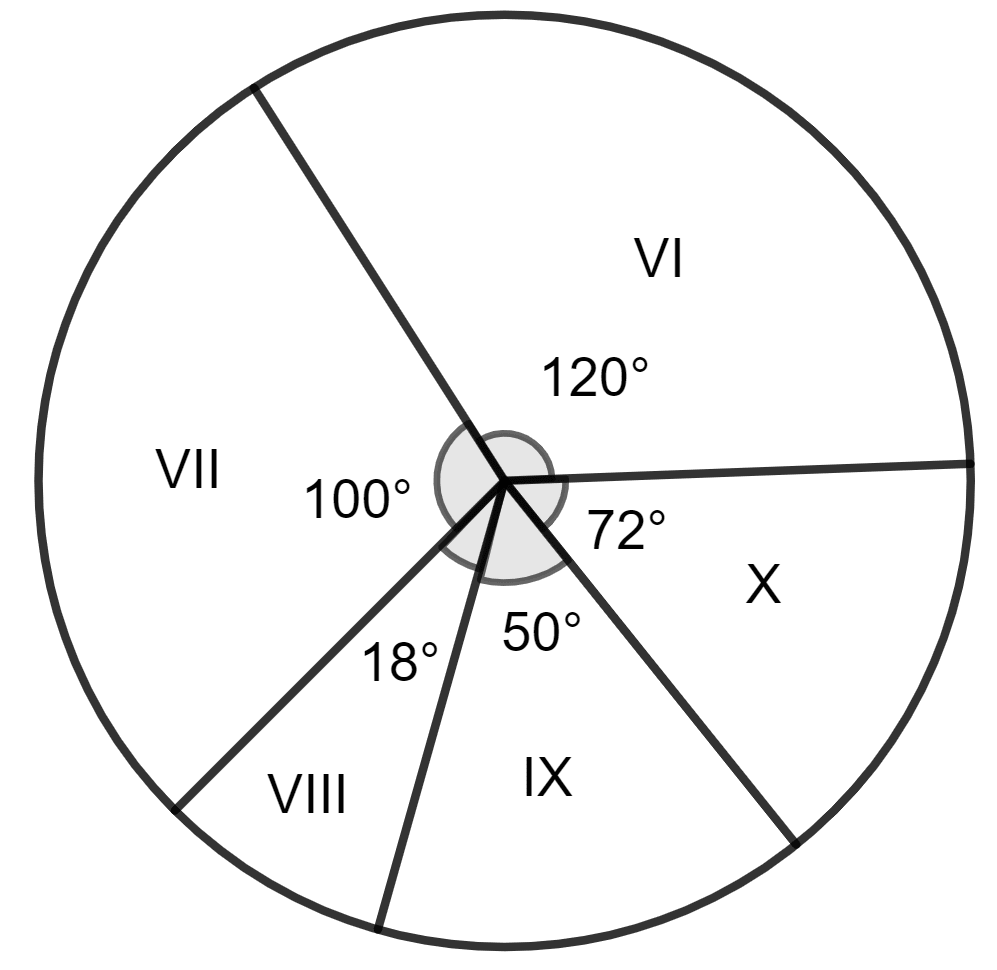
Since the angle about the center of a circle is 360°, divide 360° in proportion to the given data. In this question, divide 360° in proportion 360 : 300 : 54 : 150 : 216 to obtain the corresponding central angles.
Make a table as given.
| Class | No. of students | Central Angles |
|---|---|---|
| VI | 360 | = 120° |
| VII | 300 | = 100° |
| VIII | 54 | = 18° |
| IX | 150 | = 50° |
| X | 216 | = 72° |
| Total | 1,080 | 360° |
Draw a circle of any suitable radius.
For each central-angle, draw a sector.
Answered By
12 Likes
Related Questions
Assertion (A) : The distribution of land in Pacific Housing Society is shown in the pie chart below. The total land area for project is 144000 m2.
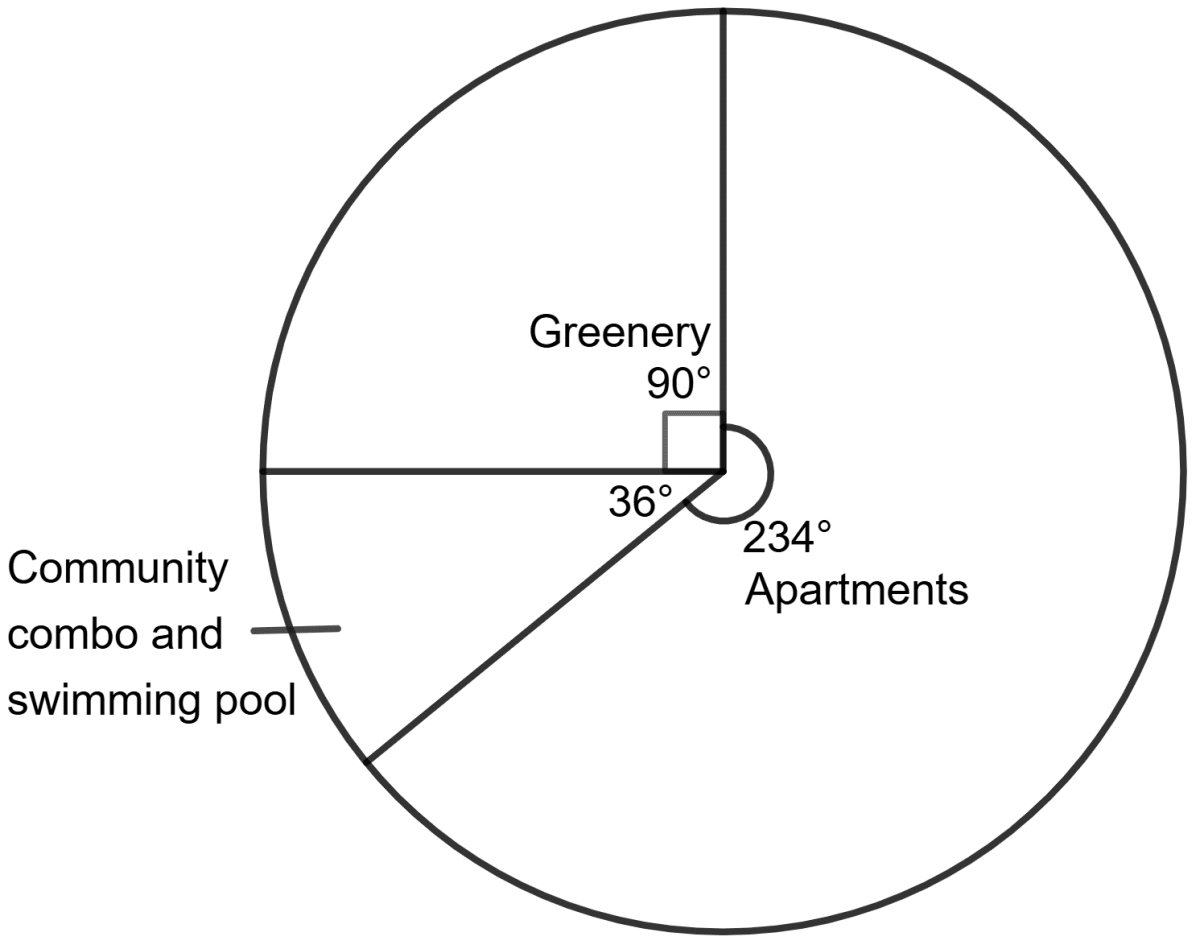
The ratio of the area kept open to the ratio of the area for apartment construction is 5 : 13.
Reason (R) : In a pie chart, the central angle of a sector suspended by its arc is proportional to the value it represents.
Both A and R are correct, and R is the correct explanation for A.
Both A and R are correct, and R is not the correct explanation for A.
A is true, but R is false.
A is false, but R is true.
Draw a bar-graph to represent the following data :
Articles : A B C D E F G Price of articles : 200 250 150 150 100 50 350 Study the given graph and then answer the following questions :
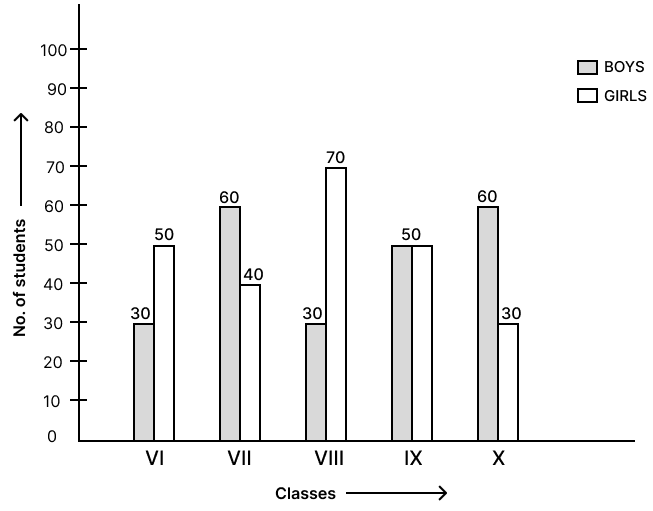
(i) Which classes have the larger number of students ?
(ii) Which class has the equal number of girls and boys ?
(iii) What is the total number of students in class VIII ?
(iv) What is the total number of students (from the class VI to class X) ?
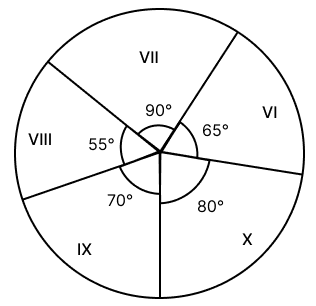
The given pie-graph represents the number of students in different classes. If the total of all the students in the class is 1080; use the graph to find the number of students in each class.