
Mathematics
Draw frequency polygons for each of the following frequency distribution :
(a) using histogram
(b) without using histogram.
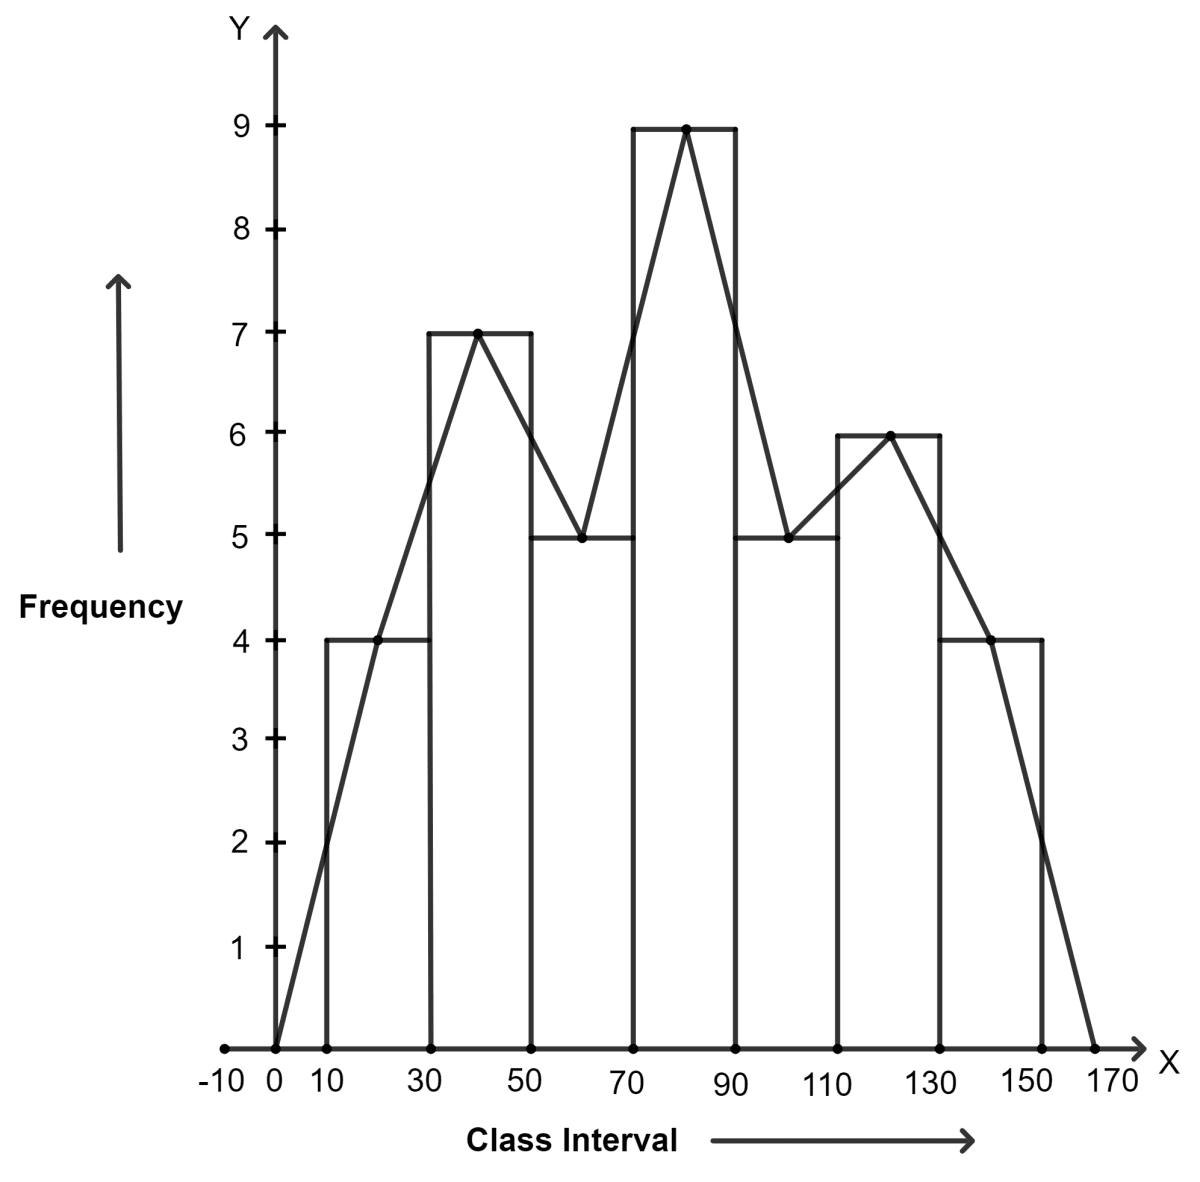
| C.I. | 10 - 30 | 30 - 50 | 50 - 70 | 70 - 90 | 90 - 110 | 110 - 130 | 130 - 150 |
|---|---|---|---|---|---|---|---|
| f | 4 | 7 | 5 | 9 | 5 | 6 | 4 |
Statistics
22 Likes
Answer
(a) Using histogram
Steps:
Draw a histogram for the given data.
Mark the mid-point at the top of each rectangle of the histogram drawn.
Also, mark the mid-point of the immediately lower class-interval (in the given question, the immediately lower class-interval is -10 - 10) and mid-point of the immediately higher class-interval (in the given question the immediate upper class-interval is 150 - 170).
Join the consecutive mid-points marked by straight lines to obtain the required frequency polygon.
(b) Without using histogram
Steps:
Find the class-mark (mid-value) of each given class-interval.
Class-mark = mid-value =
On a graph paper, mark class-marks along x-axis and frequencies along y-axis
On this graph paper, mark points taking values of class-marks along x-axis and the values of their corresponding frequencies along y-axis.
Draw line segments joining the consecutive points marked in step (3) above.
| C.I. | f | Class mark |
|---|---|---|
| -10 - 10 | 0 | = 0 |
| 10 - 30 | 4 | = 20 |
| 30 - 50 | 7 | = 40 |
| 50 - 70 | 5 | = 60 |
| 70 - 90 | 9 | = 80 |
| 90 - 110 | 5 | = 100 |
| 110 - 130 | 6 | = 120 |
| 130 - 150 | 4 | = 140 |
| 150 - 170 | 0 | = 160 |
Answered By
10 Likes
Related Questions
Fill in the blanks in the following table:
Class Interval Frequency Cumulative Frequency 25 - 34 …………… 15 35 - 44 …………… 28 45 - 54 21 …………… 55 - 64 16 …………… 65 - 74 73 75 - 84 12 …………… The value of π upto 50 decimal places is :
3.14159265358979323846264338327950288419716939937510
(i) Make a frequency distribution table of the digits from 0 to 9 after the decimal place.
(ii) Which are the most and the least occurring digits ?
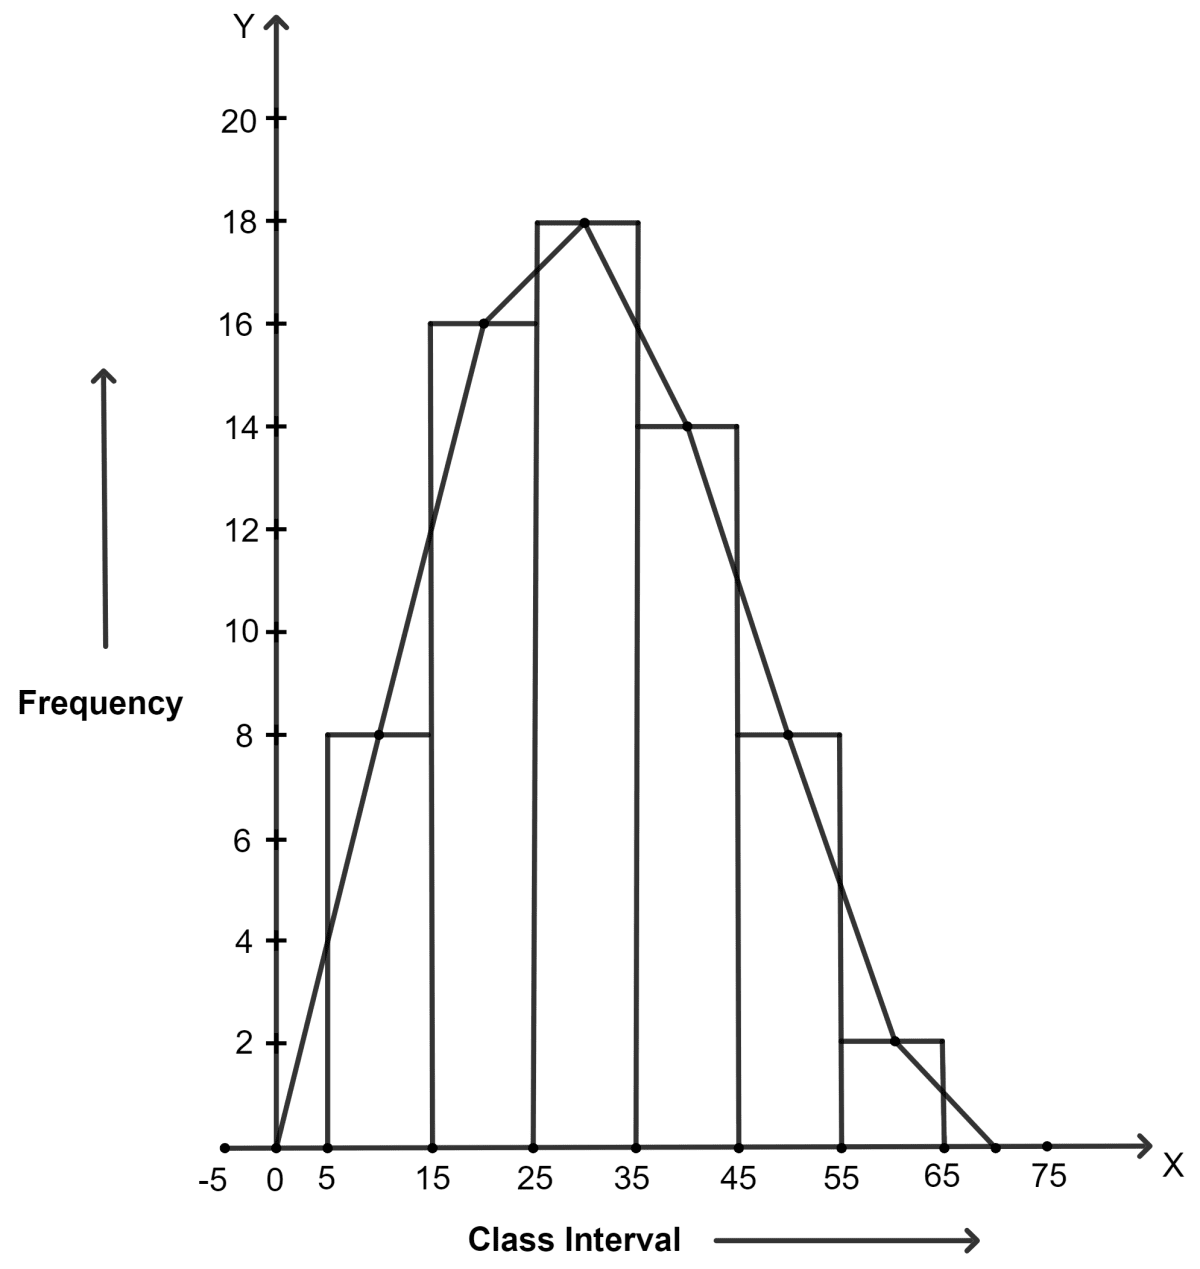
Draw frequency polygons for each of the following frequency distribution :
(a) using histogram
(b) without using histogram.
C.I. 5 - 15 15 - 25 25 - 35 35 - 45 45 - 55 55 - 65 f 8 16 18 14 8 2 Using the class intervals 0-9, 10-19, 20-29, …………… , construct the frequency distribution for :
15, 8, 12, 7, 13, 16, 22, 29, 35, 49, 37 and 48.