
Mathematics
Draw a histogram for the following distribution :
| Marks out of 80 | No. of students |
|---|---|
| 40-44 | 2 |
| 45-49 | 8 |
| 50-54 | 12 |
| 55-59 | 10 |
| 60-64 | 8 |
Hence, estimate the mode.
Statistics
8 Likes
Answer
By formula,
Adjustment factor =
= 0.5
New lower class limit = Lower class limit - Adjustment factor
New upper class limit = Upper class limit + Adjustment factor
| Marks out of 80 (Class-interval) | New class-interval | No. of students |
|---|---|---|
| 40-44 | 39.5-44.5 | 2 |
| 45-49 | 44.5-49.5 | 8 |
| 50-54 | 49.5-54.5 | 12 |
| 55-59 | 54.5-59.5 | 10 |
| 60-64 | 59.5-64.5 | 8 |
Steps of construction :
Draw a histogram of the given distribution.
Inside the highest rectangle, which represents the maximum frequency (or modal class), draw two lines AC and BD diagonally from the upper corners C and D of adjacent rectangles.
Through the point E (the point of intersection of diagonals AC and BD), draw EF perpendicular to the horizontal axis.
The value of point F on the horizontal axis represents the value of mode.
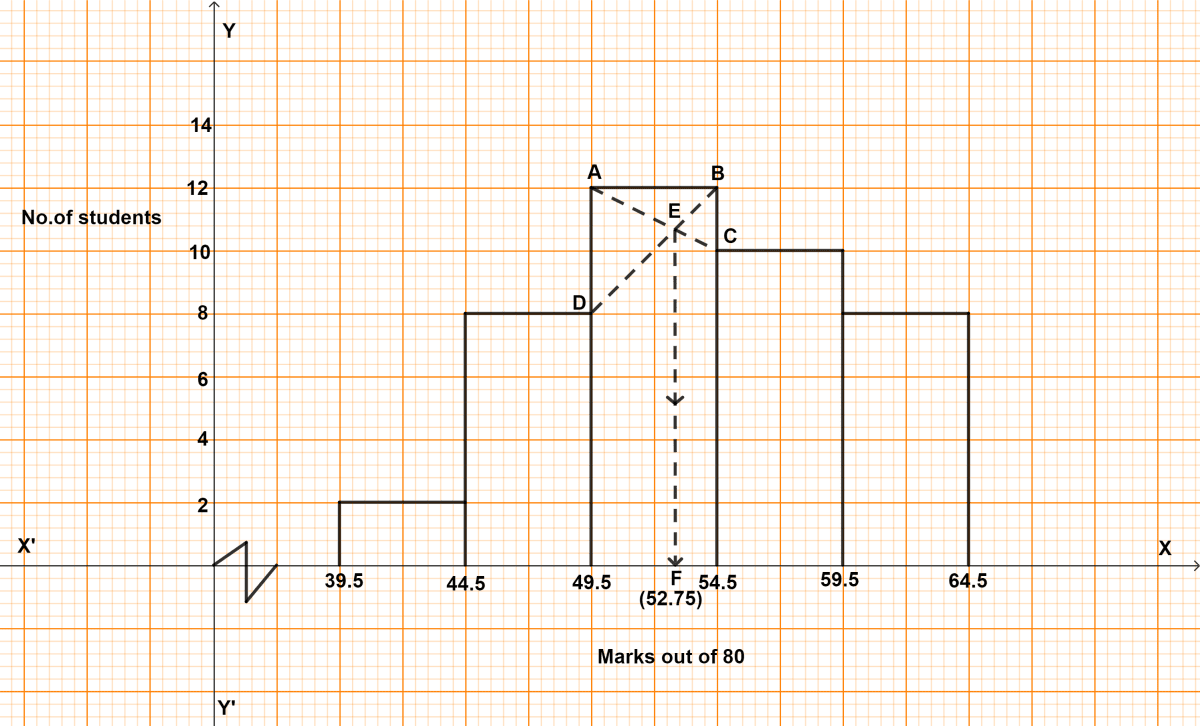
From graph,
F = 52.75
Hence, required mode = 52.75.
Answered By
3 Likes
Related Questions
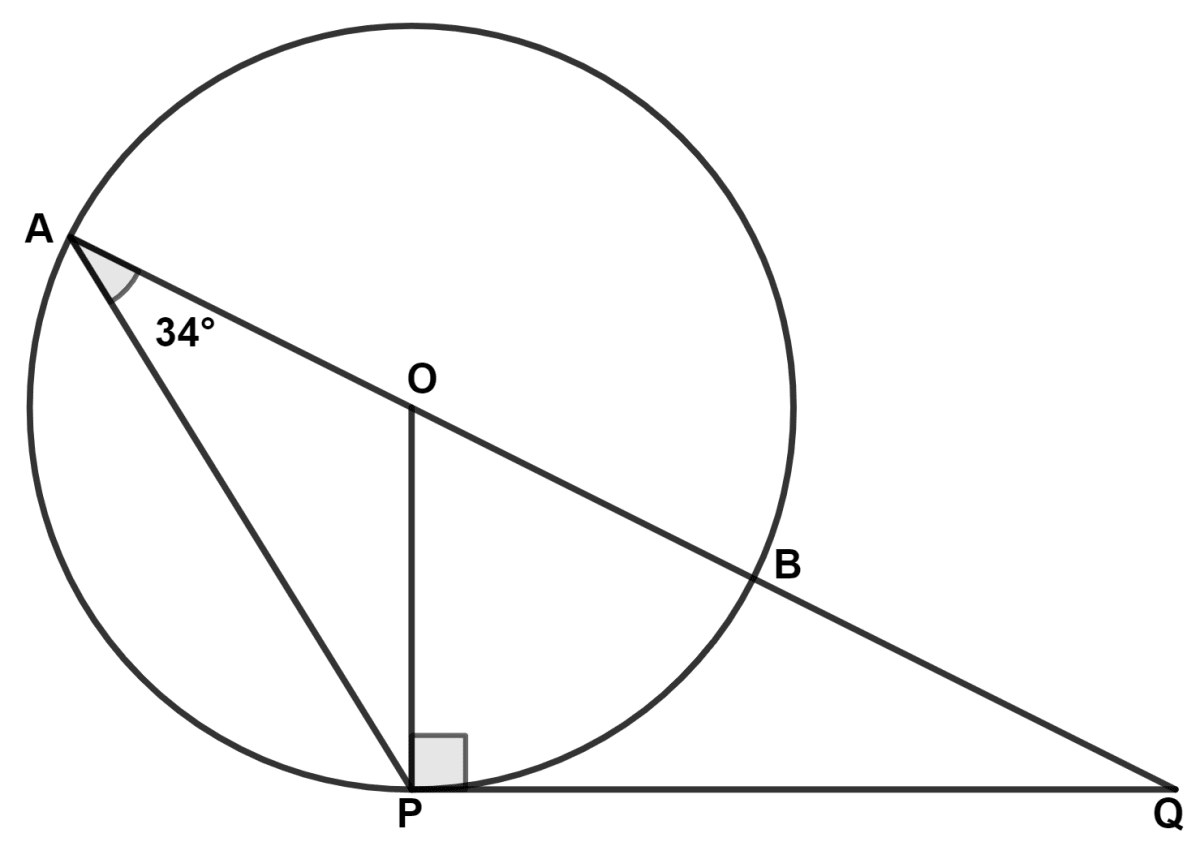
AB is a diameter of the circle with center O. The tangent at a point P meets AB produced in Q, ∠PAQ = 34°, find angles ∠PBA and ∠PQA.
The sum of first three terms of a G.P. is and their product is 1, find :
(i) the common ratio
(ii) the first three terms of this G.P.
A cylindrical ice-cream container, completely filled with ice-cream has 22 cm radius and 24 cm height. If this ice-cream is to be distributed among some children by filling it in the cone of radius 2 cm, height 7 cm and upper part of the cone which is hemisphere, then how many children will get the ice-cream cones?
The equation of a line is 7 - 3x - 4y = 0. Find :
(i) the slope of the line
(ii) the equation of the line perpendicular to the given line and passing through the intersection of the lines x - y + 2 and 3x + y - 10 = 0.