Mathematics
Draw a histogram for the given data, using a graph paper:
| Weekly Wages (in ₹) | No. of people |
|---|---|
| 3000 - 4000 | 4 |
| 4000 - 5000 | 9 |
| 5000 - 6000 | 18 |
| 6000 - 7000 | 6 |
| 7000 - 8000 | 7 |
| 8000 - 9000 | 2 |
| 9000 - 10000 | 4 |
Estimate the mode from the graph.
Answer
Steps :
Take 1 cm along x-axis = 1000 rupees and 1 cm along y-axis = 2 (No. of people).
Construct rectangles corresponding to the given data.
In highest rectangle, draw two st. lines AD and BC from corners of the rectangles on either side of the highest rectangle to the opposite corners of the highest rectangle. Let P be the point of intersection of AD and BC.
Through P, draw a vertical line to meet the x-axis at M. The abscissa of the point M represents 5400.
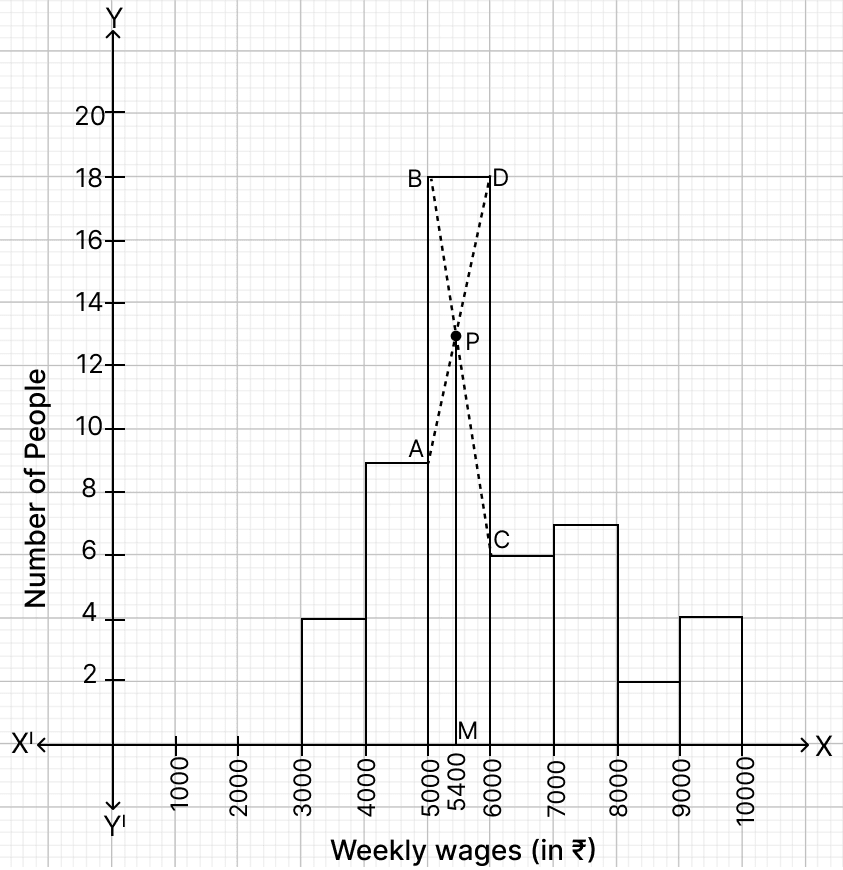
Hence, mode = ₹ 5,400.
Related Questions
Draw a histogram and estimate the mode for the following frequency distribution :
Classes Frequency 0 - 10 2 10 - 20 8 20 - 30 10 30 - 40 5 40 - 50 4 50 - 60 3 Using a graph paper, draw a histogram for the given distribution showing the number of runs scored by 50 batsmen. Estimate the mode of the data :
Runs scored No. of batsmen 3000 - 4000 4 4000 - 5000 18 5000 - 6000 9 6000 - 7000 6 7000 - 8000 7 8000 - 9000 2 9000 - 10000 4 Use a graph paper for this question. The daily pocket expenses of 200 students in a school are given below :
Daily transport expenses
(in ₹)No. of students
(frequency)0 - 5 10 5 - 10 14 10 - 15 28 15 - 20 42 20 - 25 50 25 - 30 30 30 - 35 14 35 - 40 12 Draw a histogram representing the above distribution and estimate the mode from the graph.
Draw a histogram for the following distribution :
Wt. (in kg) No. of students 40 - 44 2 45 - 49 8 50 - 54 12 55 - 59 10 60 - 64 6 65 - 69 4 Hence, estimate the modal weight.