Mathematics
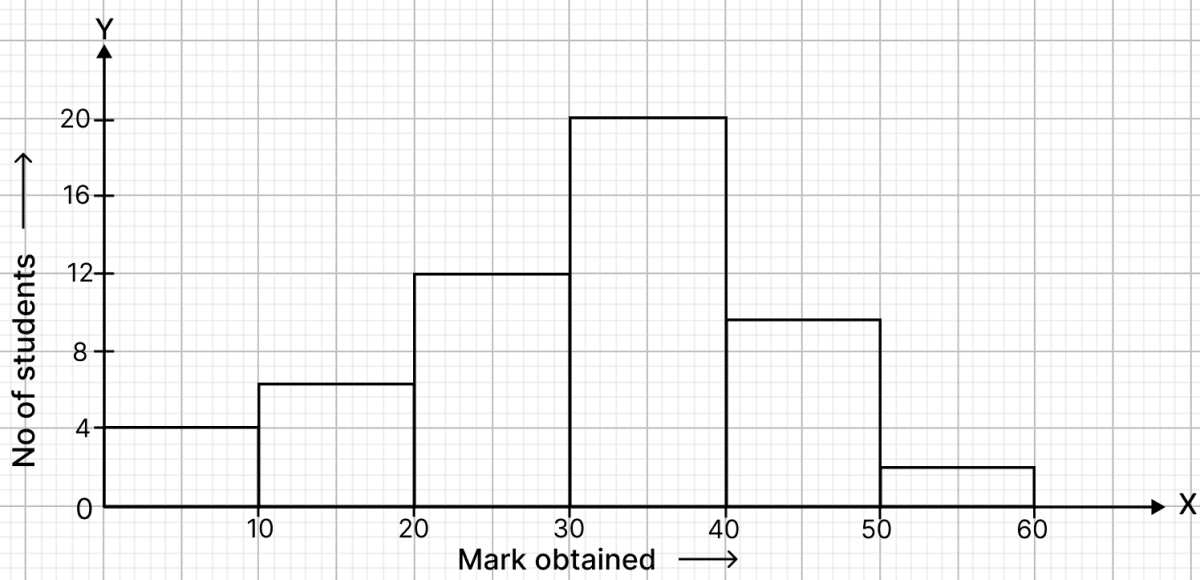
Draw a histogram to represent the following data :
| Marks obtained | No. of students |
|---|---|
| 0 - 10 | 4 |
| 10 - 20 | 7 |
| 20 - 30 | 12 |
| 30 - 40 | 20 |
| 40 - 50 | 9 |
| 50 - 60 | 2 |
Related Questions
Draw a histogram to represent the following data :
Pocket money (in ₹) No. of students 150 - 200 10 200 - 250 5 250 - 300 7 300 - 350 4 350 - 400 3 Construct a histogram for the following frequency distribution :
Class interval Frequency 5 - 12 4 13 - 20 12 21 - 28 26 29 - 36 15 37 - 44 6 45 - 52 18 The following table shows the number of illiterate persons in the age group (10 - 69) in a town
Age group (in years) No. of illiterate persons 10 - 19 50 20 - 29 125 30 - 39 190 40 - 49 275 50 - 59 340 60 - 69 410 Draw a histogram to represent the above data.
Draw a histogram to represent the following data :
Class mark Frequency 150 15 160 28 170 12 180 36 190 8 200 18 Draw a histogram to represent the above data.