Robotics & Artificial Intelligence
Explore the Pandas library to read the data that is available in .csv or .xlsx files. Plot the data with the help of Matplotlib.
Answer
The Pandas library is used to read data from .csv files, and the Matplotlib library is used to plot the data.
# data.csv

X,Y
1,2
2,4
3,6
4,8
5,10
Program
import pandas as pd
import matplotlib.pyplot as plt
data = pd.read_csv("data.csv")
plt.plot(data['X'], data['Y'])
plt.xlabel('X')
plt.ylabel('Y')
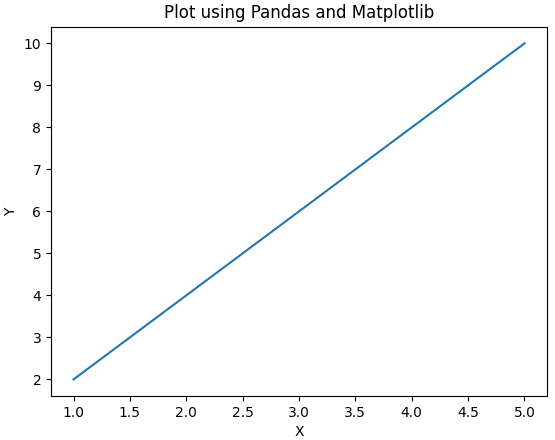
plt.title('Plot using Pandas and Matplotlib')
plt.show()
Output
Related Questions
Create a Python package and one module under it. Write Python code to use this package.
Explain any four functions of the Matplotlib library.
Write a Python program to solve the following linear equations:
2x + y = 5
x + 3y = 8Explore the Matplotlib library for plotting bar charts, line charts and pi charts.