
Mathematics
Find the mode of the following distribution by drawing a histogram :
| Mid-value | Frequency |
|---|---|
| 28 | 10 |
| 34 | 8 |
| 40 | 24 |
| 46 | 16 |
| 52 | 8 |
Statistics
6 Likes
Answer
Size of each class = difference between two consecutive mid-values = 34 - 28 = 6.
Constructing the table as under :
| Mid-value | Class | Frequency |
|---|---|---|
| 28 | 25-31 | 10 |
| 34 | 31-37 | 8 |
| 40 | 37-43 | 24 |
| 46 | 43-49 | 16 |
| 52 | 49-55 | 8 |
Steps :
Take 2 cm along x-axis = 6 units and 1 cm along y-axis = 10 units.
Since, the scale on x-axis starts at 25, a break (zig-zag curve) is shown near the origin along x-axis to indicate that the graph is drawn to scale beginning at 25 and not at origin itself.
Construct rectangles corresponding to the given data.
In highest rectangle, draw two st. lines AC and BD from corners of the rectangles on either side of the highest rectangle to the opposite corners of the highest rectangle. Let P be the point of intersection of AC and BD.
Through P, draw a vertical line to meet the x-axis at M. The abscissa of the point M represents 40.5.
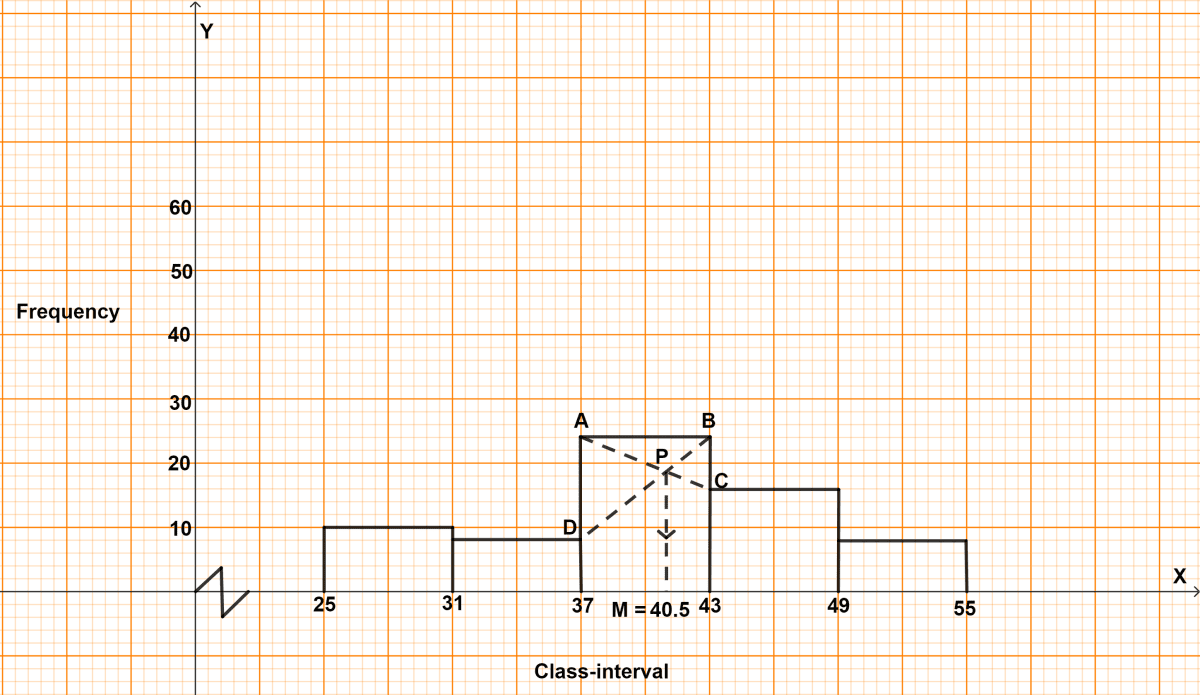
Hence, mode = 40.5
Answered By
3 Likes
Related Questions
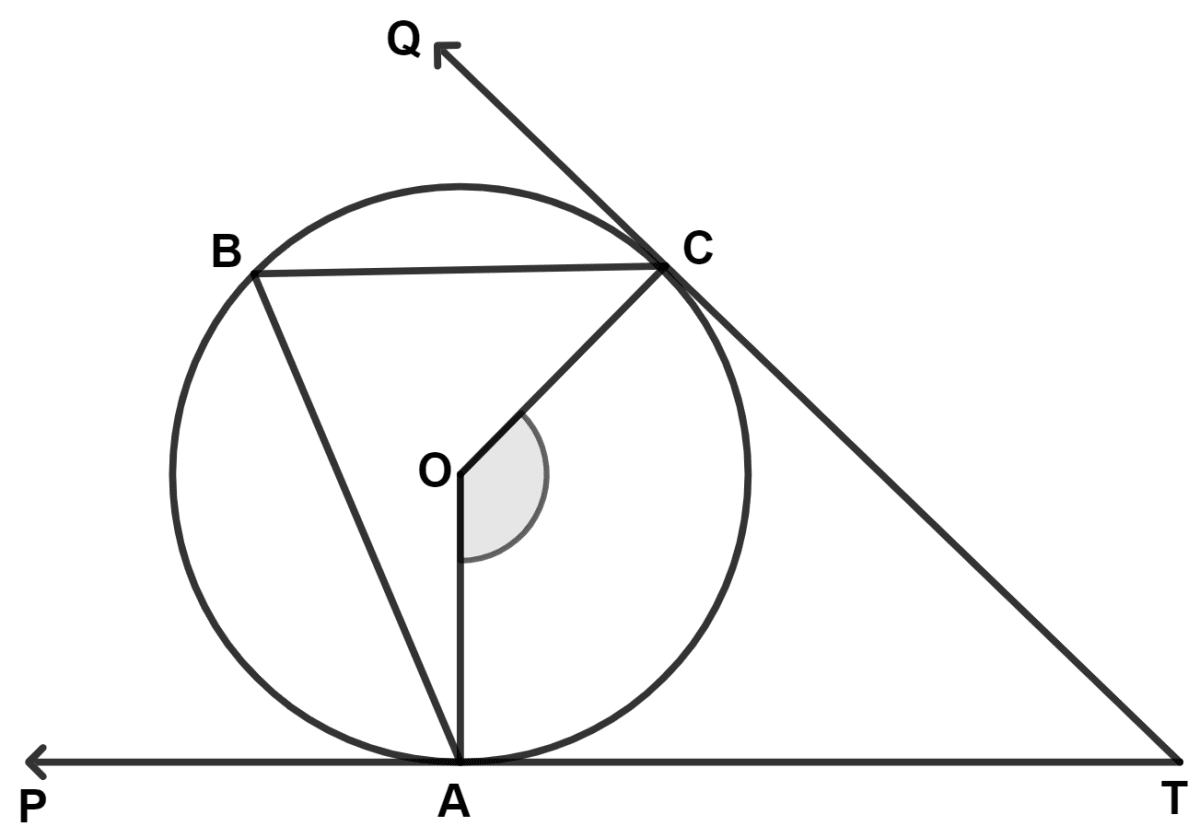
In the given figure, TP and TQ are two tangents to the circle with center O, touching the circle at points A and C respectively. If ∠BCQ = 55°, ∠BAP = 60°, find :
(i) ∠OBA
(ii) ∠OBC
(iii) ∠AOC
(iv) ∠ATC
If the third, sixth and the last terms of a G.P. are 6, 48 and 3072 respectively, find the first term and the numbers of terms in the G.P.
A semicircular sheet of metal of radius 14 cm is bent to form an open conical cup of the largest size. Find the capacity of the cup. (Take )
P and Q are two points on the x-axis and y-axis respectively. M(3, 2) divides the line segment PQ in the ratio 2 : 3. Find :
(i) the co-ordinates of the points P and Q
(ii) the slope of line segment PQ
(iii) the equation of the line through point P and perpendicular to PQ.