
Mathematics
For the following frequency distribution, draw a histogram. Hence, calculate the mode.
| Marks | Frequency |
|---|---|
| 0 - 5 | 10 |
| 5 - 10 | 14 |
| 10 - 15 | 28 |
| 15 - 20 | 42 |
| 20 - 25 | 50 |
| 25 - 30 | 30 |
| 30 - 35 | 14 |
| 35 - 40 | 12 |
Measures of Central Tendency
1 Like
Answer
Steps :
Take 1 cm along x-axis = 5 marks and 1 cm along y-axis = 5 units (frequency).
Construct rectangles corresponding to the given data.
In highest rectangle, draw two st. lines AC and BD from corners of the rectangles on either side of the highest rectangle to the opposite corners of the highest rectangle. Let P be the point of intersection of AC and BD.
Through P, draw a vertical line to meet the x-axis at M. The abscissa of the point M represents 21.50
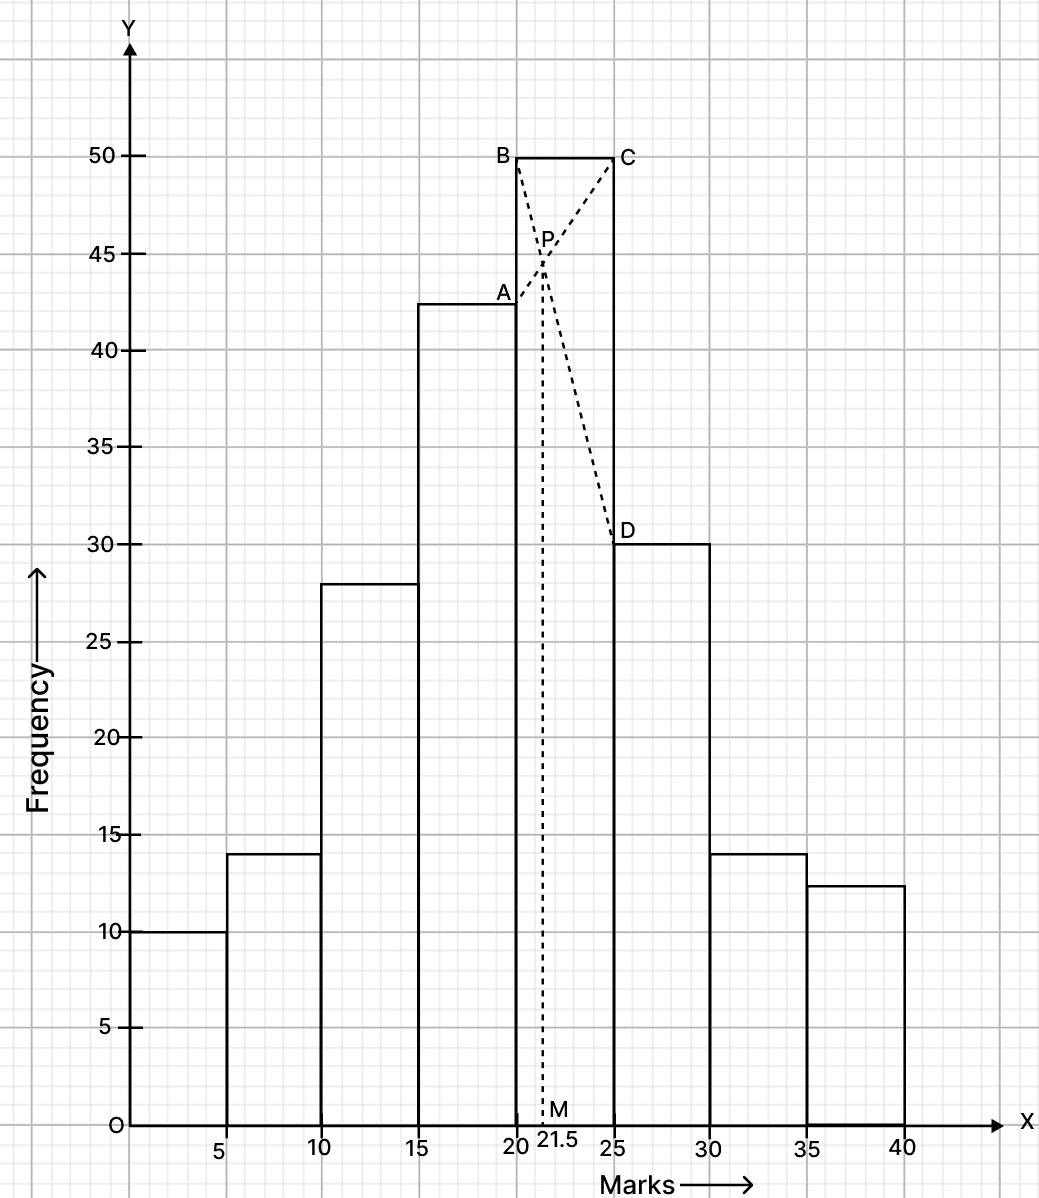
Hence, the required mode = 21.50.
Answered By
3 Likes
Related Questions
In a class of 40 students, marks obtained by the students in a class test (out of 10) are given below :
Marks Number of students 1 1 2 2 3 3 4 3 5 6 6 10 7 5 8 4 9 3 10 3 Calculate the following for the given distribution :
(i) Median
(ii) Mode
The following table gives the daily wages of workers in a factory :
Daily wages (in ₹) Number of workers 200 - 220 5 220 - 240 20 240 - 260 10 260 - 280 10 280 - 300 9 300 - 320 6 320 - 340 12 340 - 360 8 Find :
(i) the mean
(ii) the modal class
(iii) the number of workers getting daily wages below ₹ 300
(iv) the number of workers getting ₹ 260 or more but less than ₹ 340 as daily wages.
Draw a histogram and hence estimate the mode for the following distribution.
Class Frequency 0 - 5 2 5 - 10 5 10 - 15 18 15 - 20 14 20 - 25 8 25 - 30 5 IQ of 50 students was recorded as follows:
IQ score No. of students 80 - 90 6 90 - 100 9 100 - 110 16 110 - 120 13 120 - 130 4 130 - 140 2 Draw a histogram for the above data and estimate the mode.