
Mathematics
The following table shows the number of illiterate persons in the age group (10 - 69) in a town
| Age group (in years) | No. of illiterate persons |
|---|---|
| 10 - 19 | 50 |
| 20 - 29 | 125 |
| 30 - 39 | 190 |
| 40 - 49 | 275 |
| 50 - 59 | 340 |
| 60 - 69 | 410 |
Draw a histogram to represent the above data.
Statistics
1 Like
Answer
The following frequency distribution is discontinuous, to convert it into continuous frequency distribution,
Subtract the adjustment factor (0.5) from all the lower limits and add the adjustment factor (0.5) to all the upper limits.
Continuous frequency distribution for the given data is :
| Age group before adjustment | Age group after adjustment | No. of illiterate persons (Frequency) |
|---|---|---|
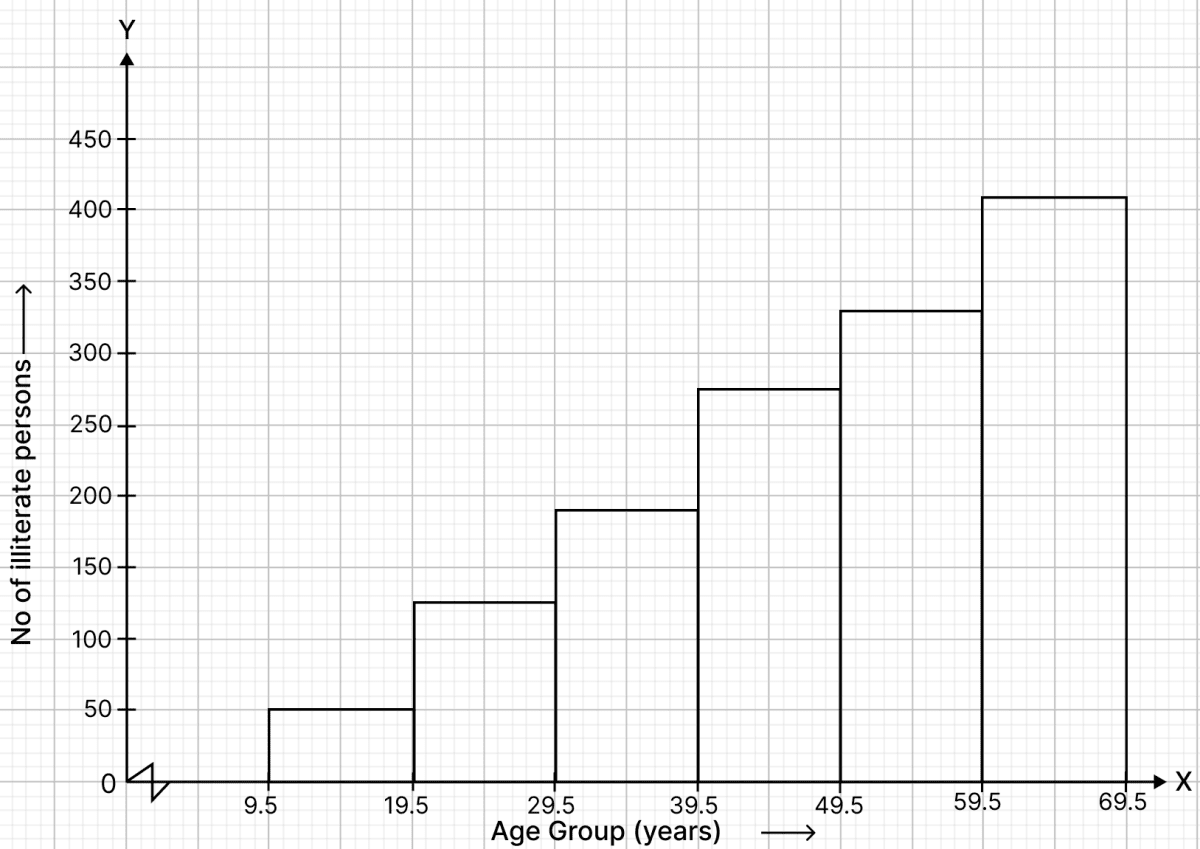
| 10 - 19 | 9.5 - 19.5 | 50 |
| 20 - 29 | 19.5 - 29.5 | 125 |
| 30 - 39 | 29.5 - 39.5 | 190 |
| 40 - 49 | 39.5 - 49.5 | 275 |
| 50 - 59 | 49.5 - 59.5 | 340 |
| 60 - 69 | 59.5 - 69.5 | 410 |
Steps of construction :
Take 2 cm along x-axis = 10 years
Take 1 cm along y-axis = 50 units
A kink is drawn near x-axis to show that the scale starts from 9.5 and not zero.
Construct rectangles corresponding to the above continuous frequency distribution table.
The required histogram is shown in the below figure:
Answered By
1 Like
Related Questions
Draw a histogram to represent the following data :
Pocket money (in ₹) No. of students 150 - 200 10 200 - 250 5 250 - 300 7 300 - 350 4 350 - 400 3 Construct a histogram for the following frequency distribution :
Class interval Frequency 5 - 12 4 13 - 20 12 21 - 28 26 29 - 36 15 37 - 44 6 45 - 52 18 Draw a histogram to represent the following data :
Class mark Frequency 150 15 160 28 170 12 180 36 190 8 200 18 Draw a histogram to represent the above data.
In a study of diabetic patients in a village, the following observations were noted :
Age in years No. of patients 10 - 20 2 20 - 30 5 30 - 40 12 40 - 50 19 50 - 60 9 60 - 70 4 Represent the above data by a frequency polygon.