Mathematics
The given graph represents the monthly salaries (in ₹) of workers of a factory.
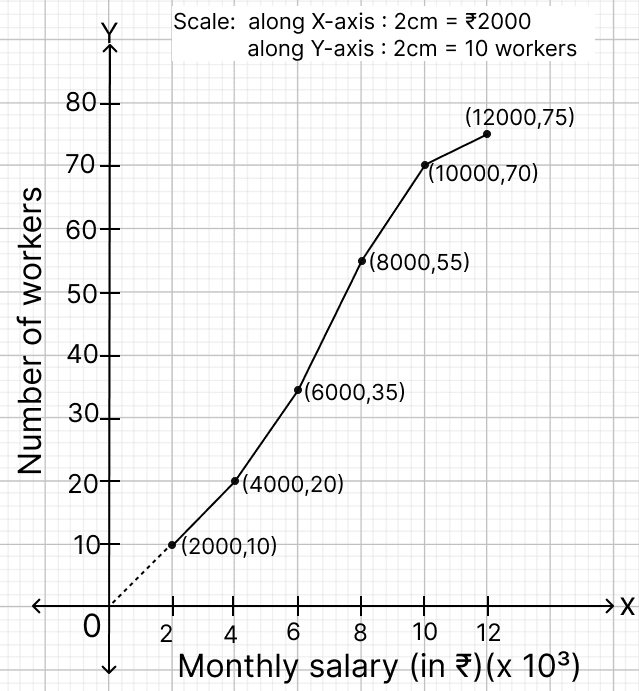
Using graph answer the following:
(a) the total number of workers.
(b) the median class.
(c) the lower-quartile class.
(d) number of workers having monthly salary more than or equal to ₹6,000 but less than ₹10,000.
Related Questions
Ms. Sushmita went to a fair and participated in a game. The game consisted of a box having number cards with numbers from 01 to 30. The three prizes were as per the given table:
Prize Number on the card drawn at random is a Wall clock perfect square Water bottle even number which is also a multiple of 3 Purse prime number Find the probability of winning a:
(a) Wall Clock
(b) Water Bottle
(c) Purse
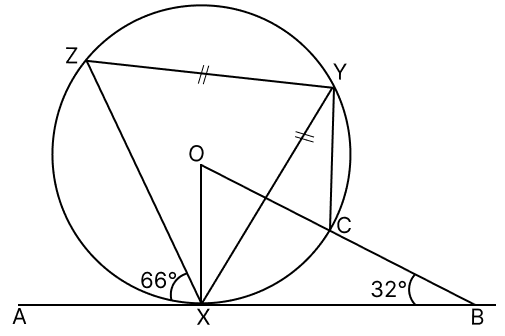
X, Y, Z and C are the points on the circumference of a circle with centre O. AB is a tangent to the circle at X and ZY = XY. Given ∠OBX = 32° and ∠AXZ = 66°. Find:
(a) ∠BOX
(b) ∠CYX
(c) ∠ZYX
(d) ∠OXY
If 1701 is the nth term of the Geometric Progression (G.P.) 7, 21, 63……, find :
(a) the value of 'n'
(b) hence find the sum of the 'n' terms of the G.P.
In the given diagram O is the centre of the circle. Chord SR produced meets the tangent XTP at P.
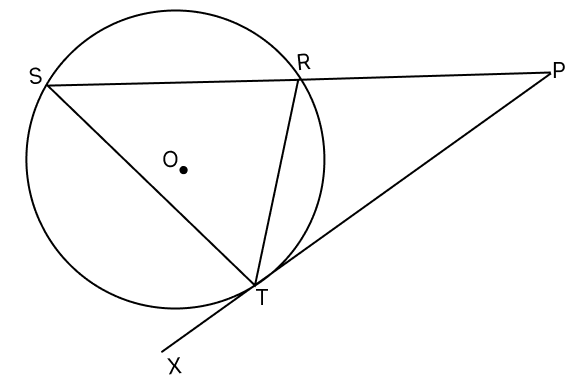
(a) Prove that ΔPTR ~ ΔPST
(b) Prove that PT2 = PR × PS
(c) If PR = 4 cm and PS = 16 cm, find the length of the tangent PT.