Mathematics
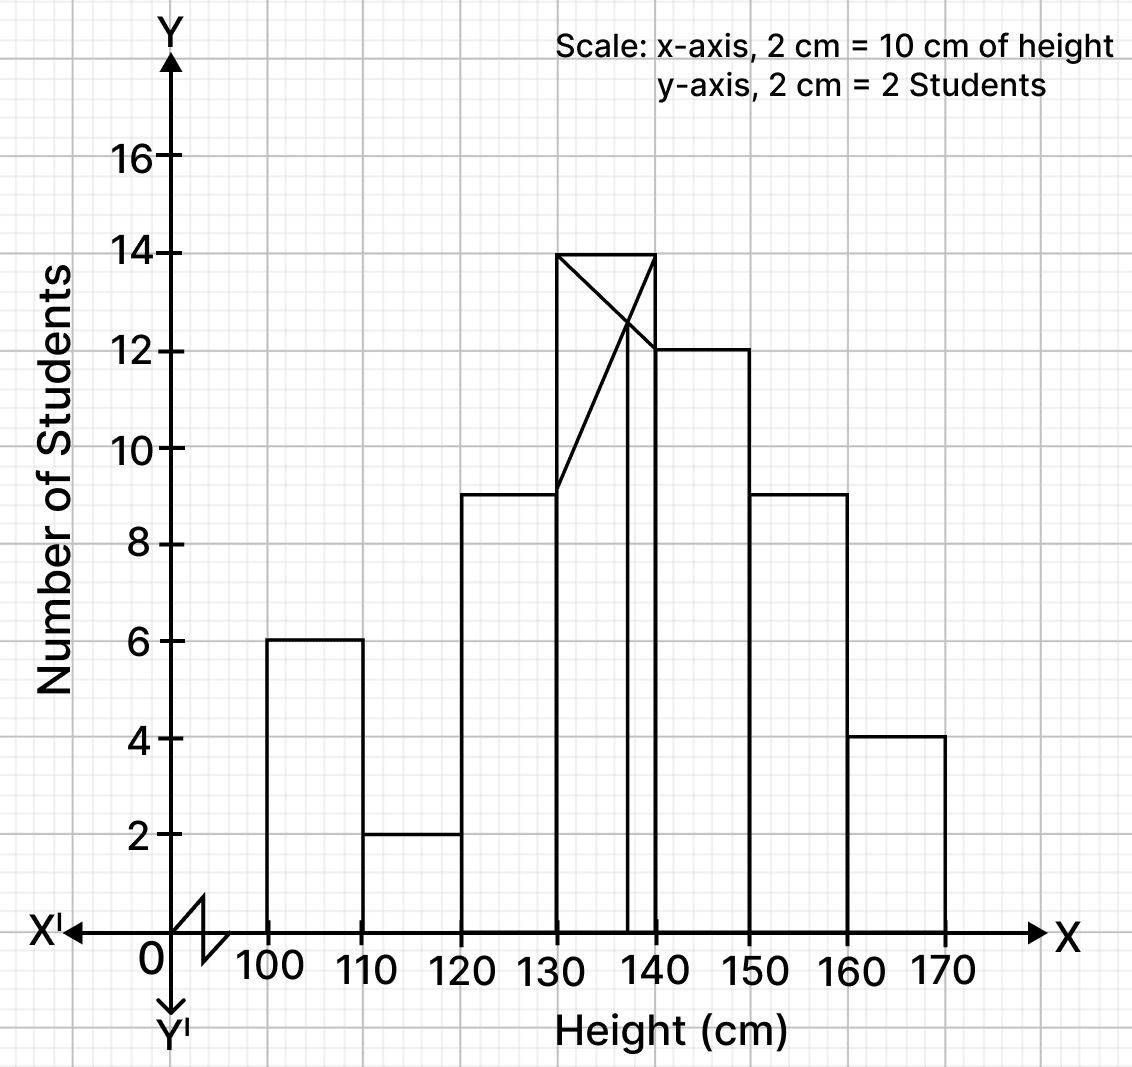
The histogram drawn on the graph represents the number of students of different heights (in cm).
Using the graph, answer the following :
(a) the number of students whose height is 150 cm and above.
(b) the modal height.
(c) the total number of students.
Answer
(a) From graph,
Students whose height is 150 cm and above :
150 - 160 = 9 students
160 - 170 = 4 students
Total number of students whose height is 150 cm and above = 9 + 4 = 13
Hence, number of students whose height is 150 cm and above = 13.
(b) From graph,
The vertical line intersects the x-axis at 137.
Hence, the modal height = 137 cm.
(c) Total number of students = 6 + 2 + 9 + 14 + 12 + 9 + 4 = 56.
Hence, total number of students = 56.
Related Questions
The cost price of a TV set is ₹ 20,000. The shopkeeper marked it for ₹ 24,000. He sells it to a customer at a discount of 10% on the marked price. If the sale is intra-state and the rate of GST is 12%, find the:
(a) discounted price of the TV set.
(b) amount paid by the customer to clear the bill.
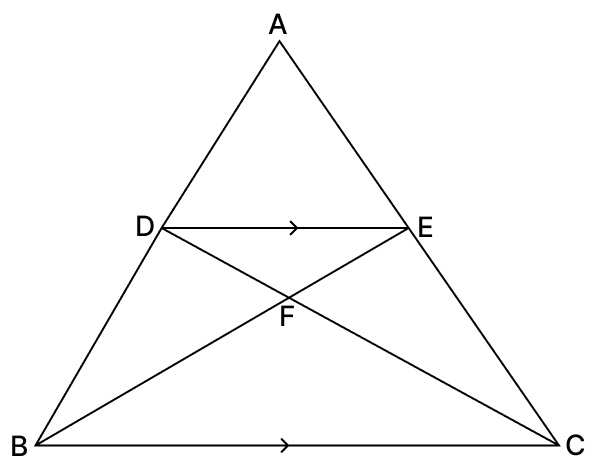
In the given diagram, DE || BC and AD : DB = 2 : 3.
(a) Prove that : ΔADE ~ ΔABC and hence find DE : BC.
(b) Prove : ΔDFE ~ ΔCFB
(c) Given, area of ΔDFE = 16 square units, find the area of ΔCFB.
A(−10, −2) and B(2, 10) are two end points of a line segment. If AB intersects the x-axis at P, find the :
(a) ratio in which ‘P’ divides AB.
(b) coordinates of point P.
Solve the quadratic equation (x − 2)2 − 5x − 3 = 0 and give your answer correct to 3 significant figures.