Mathematics
IQ of 50 students was recorded as follows:
| IQ score | No. of students |
|---|---|
| 80 - 90 | 6 |
| 90 - 100 | 9 |
| 100 - 110 | 16 |
| 110 - 120 | 13 |
| 120 - 130 | 4 |
| 130 - 140 | 2 |
Draw a histogram for the above data and estimate the mode.
Answer
Steps :
Take 1 cm along x-axis = 10 scores and 1 cm along y-axis = 4 (students).
Since, the scale on x-axis starts at 80, a break (zig-zag curve) is shown near the origin along x-axis to indicate that the graph is drawn to scale beginning at 80 and not at origin itself.
Construct rectangles corresponding to the given data.
In highest rectangle, draw two straight lines AC and BD from corners of the rectangles on either side of the highest rectangle to the opposite corners of the highest rectangle. Let P be the point of intersection of AC and BD.
Through P, draw a vertical line to meet the x-axis at M. The abscissa of the point M represents 107.
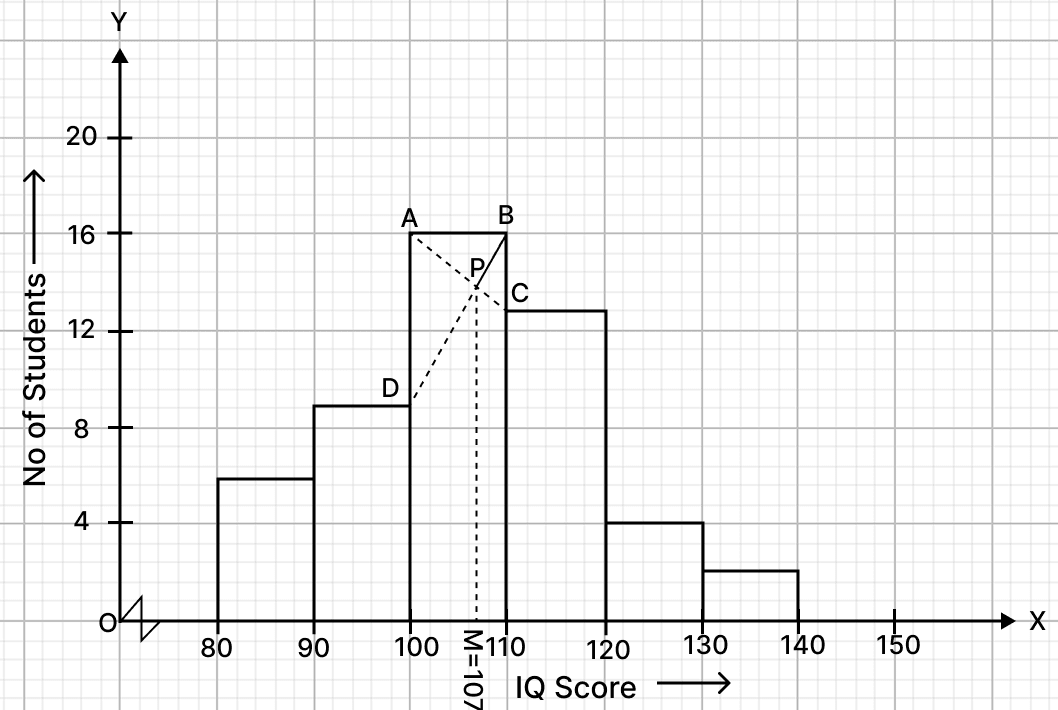
Hence, the required mode = 107.
Related Questions
For the following frequency distribution, draw a histogram. Hence, calculate the mode.
Marks Frequency 0 - 5 10 5 - 10 14 10 - 15 28 15 - 20 42 20 - 25 50 25 - 30 30 30 - 35 14 35 - 40 12 Draw a histogram and hence estimate the mode for the following distribution.
Class Frequency 0 - 5 2 5 - 10 5 10 - 15 18 15 - 20 14 20 - 25 8 25 - 30 5 For the following distribution, draw a histogram :
Weight (in kg) Frequency 44 - 47 23 48 - 51 25 52 - 55 37 56 - 59 18 60 - 63 7 64 - 67 2 From the histogram, estimate the mode.
Using a graph paper, draw a histogram for the given distribution showing the number of runs scored by 50 batsmen. From the histogram, estimate the mode of the data:
Runs scored No. of batsmen 3000 - 4000 4 4000 - 5000 18 5000 - 6000 9 6000 - 7000 6 7000 - 8000 7 8000 - 9000 2 9000 - 10000 4