
Mathematics
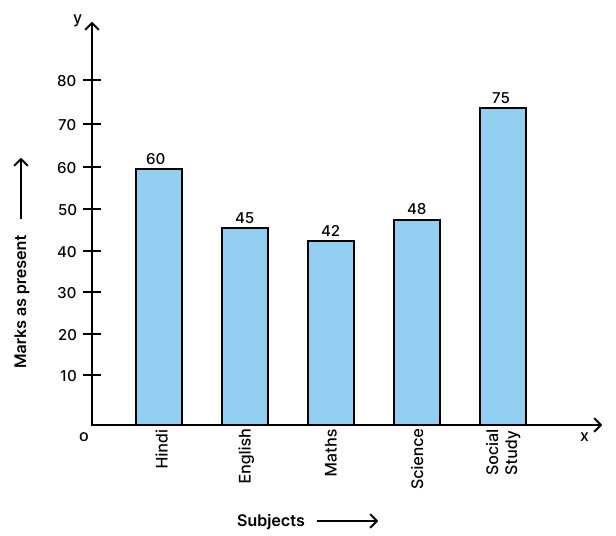
Manoj appeared for ICSE examination 2018 and secured percentage of marks as shown in the following table :
| Subjects | Hindi | English | Maths | Science | Social Study |
|---|---|---|---|---|---|
| Marks as percent | 60 | 45 | 42 | 48 | 75 |
Represent the above data by drawing a suitable bar graph.
Statistics
12 Likes
Answer
Steps:
On a graph paper, draw two mutually perpendicular lines OX and OY which intersect each other at point O.
The line OX is taken horizontal and is called the x-axis, whereas the line OY is taken vertical and is called the y-axis.
On the x-axis, starting from O, mark points at equal distances. At these points write the names of the different subjects given. In this question, the names are Hindi, English, Maths, Science and Social Study.
Along y-axis, mark the heights of the bars (rectangles) in proportion to the given data (Marks as percent).
Remember:
(i) The heights of different bars (rectangles) are parallel to y-axis and the mid-points of their bases are on the points marked on the x-axis (step 2).
(ii) The bars may be taken of any suitable width, but widths of all the bars must be the same.
(iii) The space (distance) between consecutive bars may be of any suitable value, but the spaces between all the consecutive bars must be the same.
The required bar graph is as given below:
Answered By
9 Likes
Related Questions
Students of a small school use different modes of travel to school as shown below :
Modes Bus Car Bicycle Auto On foot No. of students 142 98 50 34 16 Draw a suitable bar graph.
For the following table, draw a bar-graph.
A B C D E F 230 400 350 200 380 160 For the data given above in question number 8, draw a suitable pie-graph.
Mr. Kapoor compares the prices (in ₹) of different items at two different shops A and B. Examine the following table carefully and represent the data by a double bar graph.
Items Price (in ₹) at shop A Price (in ₹) at shop B Tea-set 900 950 Mixer 700 800 Coffee-maker 600 700 Dinner set 600 500