
Mathematics
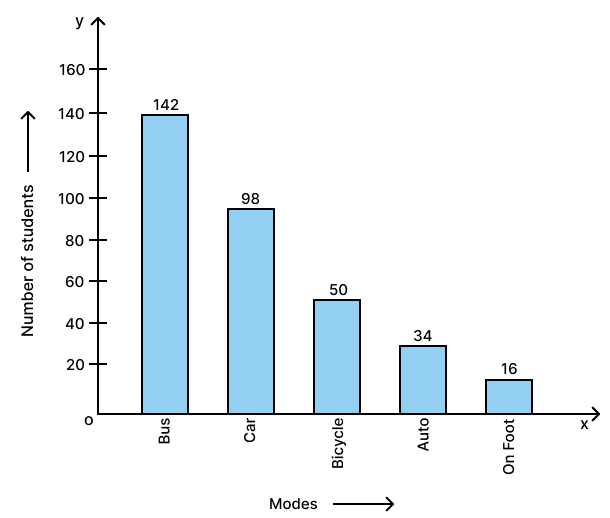
Students of a small school use different modes of travel to school as shown below :
| Modes | Bus | Car | Bicycle | Auto | On foot |
|---|---|---|---|---|---|
| No. of students | 142 | 98 | 50 | 34 | 16 |
Draw a suitable bar graph.
Statistics
8 Likes
Answer
Steps:
On a graph paper, draw two mutually perpendicular lines OX and OY which intersect each other at point O.
The line OX is taken horizontal and is called the x-axis, whereas the line OY is taken vertical and is called the y-axis.
On the x-axis, starting from O, mark points at equal distances. At these points write the names of the different modes of travel given. In this question, the names are Bus, Car, Bicycle, Auto and On foot.
Along y-axis, mark the heights of the bars (rectangles) in proportion to the given data (Number of students).
Remember:
(i) The heights of different bars (rectangles) are parallel to y-axis and the mid-points of their bases are on the points marked on the x-axis (step 2).
(ii) The bars may be taken of any suitable width, but widths of all the bars must be the same.
(iii) The space (distance) between consecutive bars may be of any suitable value, but the spaces between all the consecutive bars must be the same.
The required bar graph is as given below:
Answered By
5 Likes
Related Questions
The percentage of marks obtained in different subjects by Ashok Sharma (in an examination) are given below. Draw a bar graph to represent it.
English Hindi Maths Science Social Studies 85 60 35 50 70 The following table shows the market position of different brands of tea leaves.
Brands A B C D others % Buyers 35 20 20 15 10 Draw a pie-chart to represent the above information.
For the following table, draw a bar-graph.
A B C D E F 230 400 350 200 380 160 Manoj appeared for ICSE examination 2018 and secured percentage of marks as shown in the following table :
Subjects Hindi English Maths Science Social Study Marks as percent 60 45 42 48 75 Represent the above data by drawing a suitable bar graph.