
Mathematics
The following table shows the market position of different brands of tea leaves.
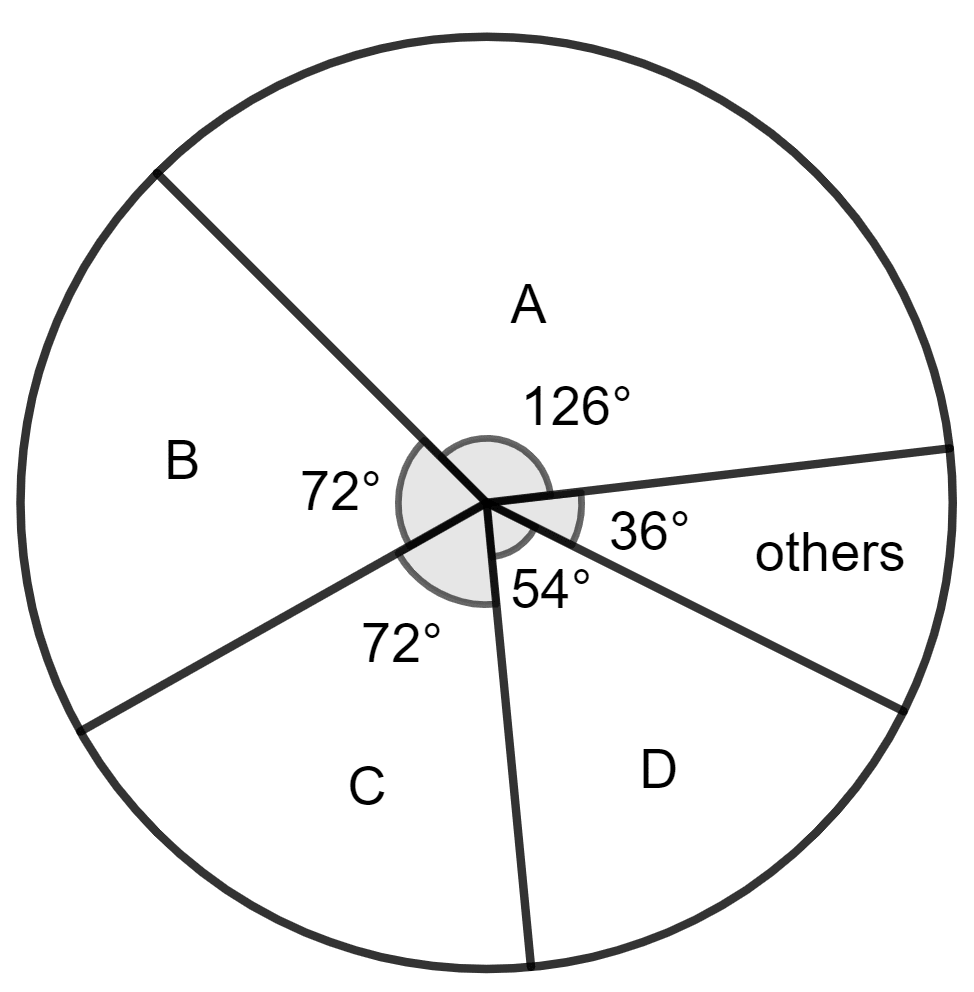
| Brands | A | B | C | D | others |
|---|---|---|---|---|---|
| % Buyers | 35 | 20 | 20 | 15 | 10 |
Draw a pie-chart to represent the above information.
Statistics
15 Likes
Answer
Steps:
Since the angle about the center of a circle is 360°, divide 360° in proportion to the given data. In this question, divide 360° in proportion 35 : 20 : 20 : 15 : 10 to obtain the corresponding central angles.
Make a table as given.
| Brands | Buyers | Central Angles |
|---|---|---|
| A | 35 | = 126° |
| B | 20 | = 72° |
| C | 20 | = 72° |
| D | 15 | = 54° |
| Others | 10 | = 36° |
| Total | 100 | 360° |
Draw a circle of any suitable radius.
For each central-angle, draw a sector.
Answered By
5 Likes
Related Questions
Mr. Mirza's monthly income is ₹ 7,200. He spends ₹ 1,800 on rent, ₹ 2,700 on food, ₹ 900 on education of his children, ₹ 1,200 on other things and saves the rest.
Draw a pie-chart to represent it.
The percentage of marks obtained in different subjects by Ashok Sharma (in an examination) are given below. Draw a bar graph to represent it.
English Hindi Maths Science Social Studies 85 60 35 50 70 Students of a small school use different modes of travel to school as shown below :
Modes Bus Car Bicycle Auto On foot No. of students 142 98 50 34 16 Draw a suitable bar graph.
For the following table, draw a bar-graph.
A B C D E F 230 400 350 200 380 160