
Mathematics
The marks of 200 students in a test were recorded as follows :
| Marks % | No. of students |
|---|---|
| 0-10 | 5 |
| 10-20 | 7 |
| 20-30 | 11 |
| 30-40 | 20 |
| 40-50 | 40 |
| 50-60 | 52 |
| 60-70 | 36 |
| 70-80 | 15 |
| 80-90 | 9 |
| 90-100 | 5 |
Using graph sheet draw ogive for the given data and use it to find the,
(a) median
(b) number of students who obtained more than 65% marks
(c) number of students who did not pass, if the pass percentage was 35.
Statistics
ICSE Sp 2025
46 Likes
Answer
| Marks % | No. of students (f) | CF |
|---|---|---|
| 0-10 | 5 | 5 |
| 10-20 | 7 | 12 |
| 20-30 | 11 | 23 |
| 30-40 | 20 | 43 |
| 40-50 | 40 | 83 |
| 50-60 | 52 | 135 |
| 60-70 | 36 | 171 |
| 70-80 | 15 | 186 |
| 80-90 | 9 | 195 |
| 90-100 | 5 | 200 |
Steps :
Take 1 cm = 10 marks on x-axis.
Take 1 cm = 20 students on y-axis.
Plot the points (10, 5), (20, 12), (30, 23), (40, 43), (50, 83), (60, 135), (70, 171), (80, 186), (90, 195) and (100, 200).
Join the points by free hand curve.
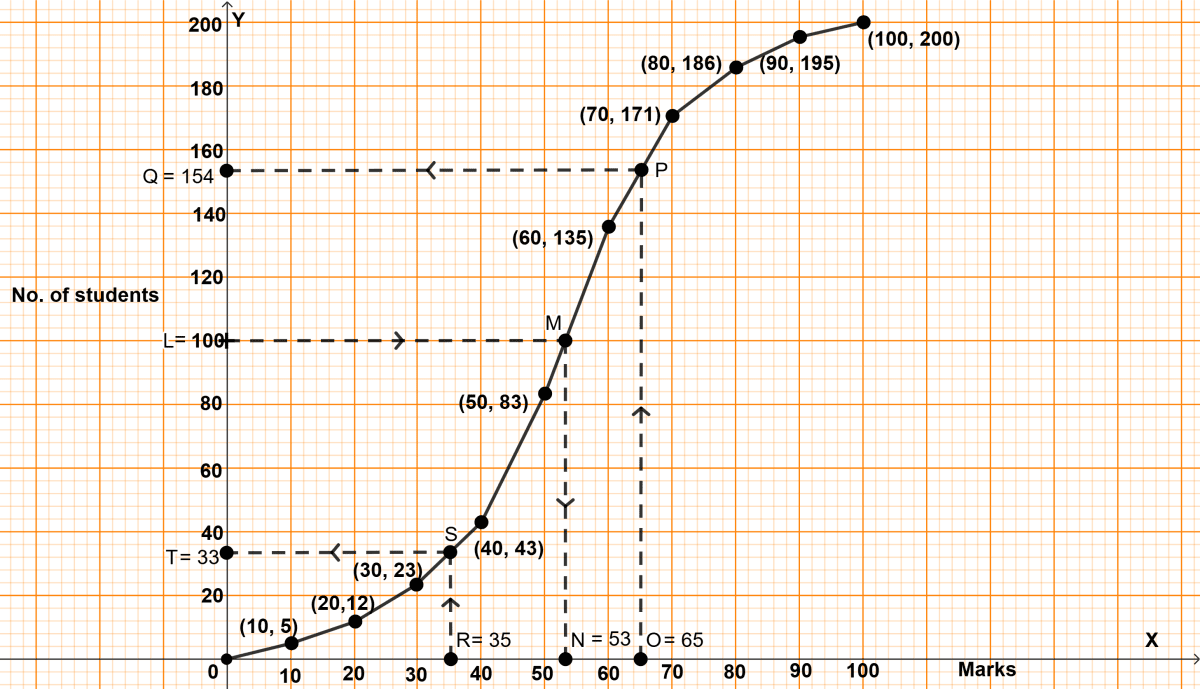
(a) n = 200, which is even
Median = = 100th term.
Through point L = 100 draw a horizontal line parallel to x-axis touching the graph at point M, through M draw a vertical line parallel to y-axis touching x-axis at point N = 53.
Hence, median = 53.
(b) Total marks = 100
65% of 100 = 65
Through point O = 65 draw a vertical line parallel to y-axis touching the graph at point P, through P draw a horizontal line parallel to x-axis touching y-axis at point Q = 154.
∴ 154 students score less than or equal to 65%.
∴ 46 (200 - 154) students score more than 65%.
Hence, 46 students score more than 65%.
(c) Total marks = 100
35% of 100 = 35
Through point R = 35 draw a vertical line parallel to y-axis touching the graph at point S, through S draw a horizontal line parallel to x-axis touching y-axis at point T = 33.
Hence, 33 students did not pass the exam.
Answered By
29 Likes
Related Questions
The following bill shows the GST rate and the marked price of articles :
Rajdhani Departmental Store
S.No. Item Marked price Discount Rate of GST (a) Dry fruits (1 kg) ₹ 1200 ₹ 100 12% (b) Packed Wheat Flour (5 kg) ₹ 286 Nil 5% (c) Bakery Products ₹ 500 10% 12% Find the total amount to be paid (including GST) for the above bill.
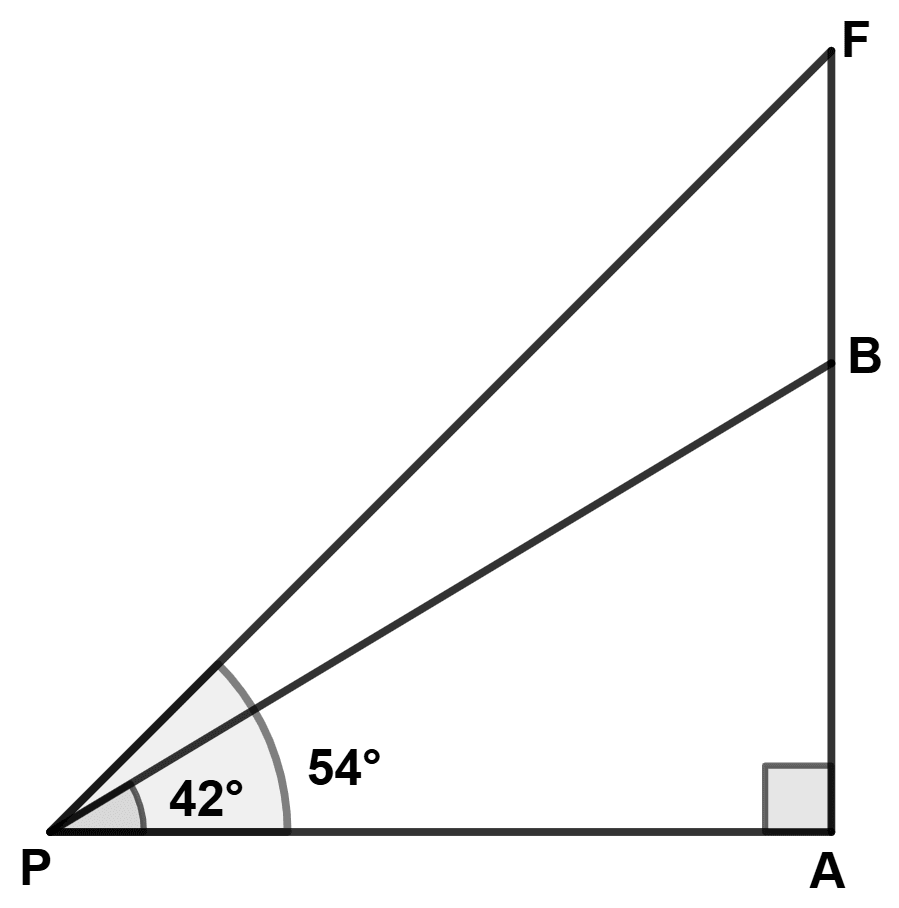
A vertical tower standing on a horizontal plane is surmounted by a vertical flagstaff. At a point 100 m away from the foot of the tower, the angle of elevation of the top and bottom of the flagstaff are 54° and 42° respectively. Find the height of the flagstaff. Give your answer correct to nearest metre.
In a T.V. show, a contestant opts for video call a friend life line to get an answer from three of his friends, named Amar, Akbar and Anthony. The question which he asks from one of his friends has four options. Find the probability that :
(a) Akbar is chosen for the call.
(b) Akbar couldn't give the correct answer.
If x, y and z are in continued proportion, prove that :