
Mathematics
Marks obtained by 200 students in an examination are given below:
| Marks | Number of students |
|---|---|
| 0 - 10 | 5 |
| 10 - 20 | 10 |
| 20 - 30 | 14 |
| 30 - 40 | 21 |
| 40 - 50 | 25 |
| 50 - 60 | 34 |
| 60 - 70 | 36 |
| 70 - 80 | 27 |
| 80 - 90 | 16 |
| 90 - 100 | 12 |
Draw an ogive for the given distribution taking 2 cm = 10 marks on one axis and 2 cm = 20 students on other axis. From the graph, find:
(i) the median
(ii) the upper-quartile
(iii) number of students scoring more than 65 marks
(iv) if 10 students qualify for merit-scholarship, find the minimum marks required to qualify.
Measures of Central Tendency
1 Like
Answer
Cumulative frequency distribution table :
| Marks | Number of students | Cumulative frequency |
|---|---|---|
| 0 - 10 | 5 | 5 |
| 10 - 20 | 10 | 15 (10 + 5) |
| 20 - 30 | 14 | 29 (15 + 14) |
| 30 - 40 | 21 | 50 (29 + 21) |
| 40 - 50 | 25 | 75 (50 + 25) |
| 50 - 60 | 34 | 109 (75 + 34) |
| 60 - 70 | 36 | 145 (109 + 36) |
| 70 - 80 | 27 | 172 (145 + 27) |
| 80 - 90 | 16 | 188 (172 + 16) |
| 90 - 100 | 12 | 200 (188 + 12) |
Here, n = 200, which is even.
Steps of construction:
Take 1 cm along x-axis = 10 marks
Take 2 cm along y-axis = 20 students
Plot the point (0, 0) as ogive starts from x- axis representing lower limit of first class.
Plot the points (10, 5), (20, 15), (30, 29), (40, 50), (50, 75), (60, 109), (70, 145), (80, 172), (90, 188), (100, 200).
Joint the points by a free hand curve.
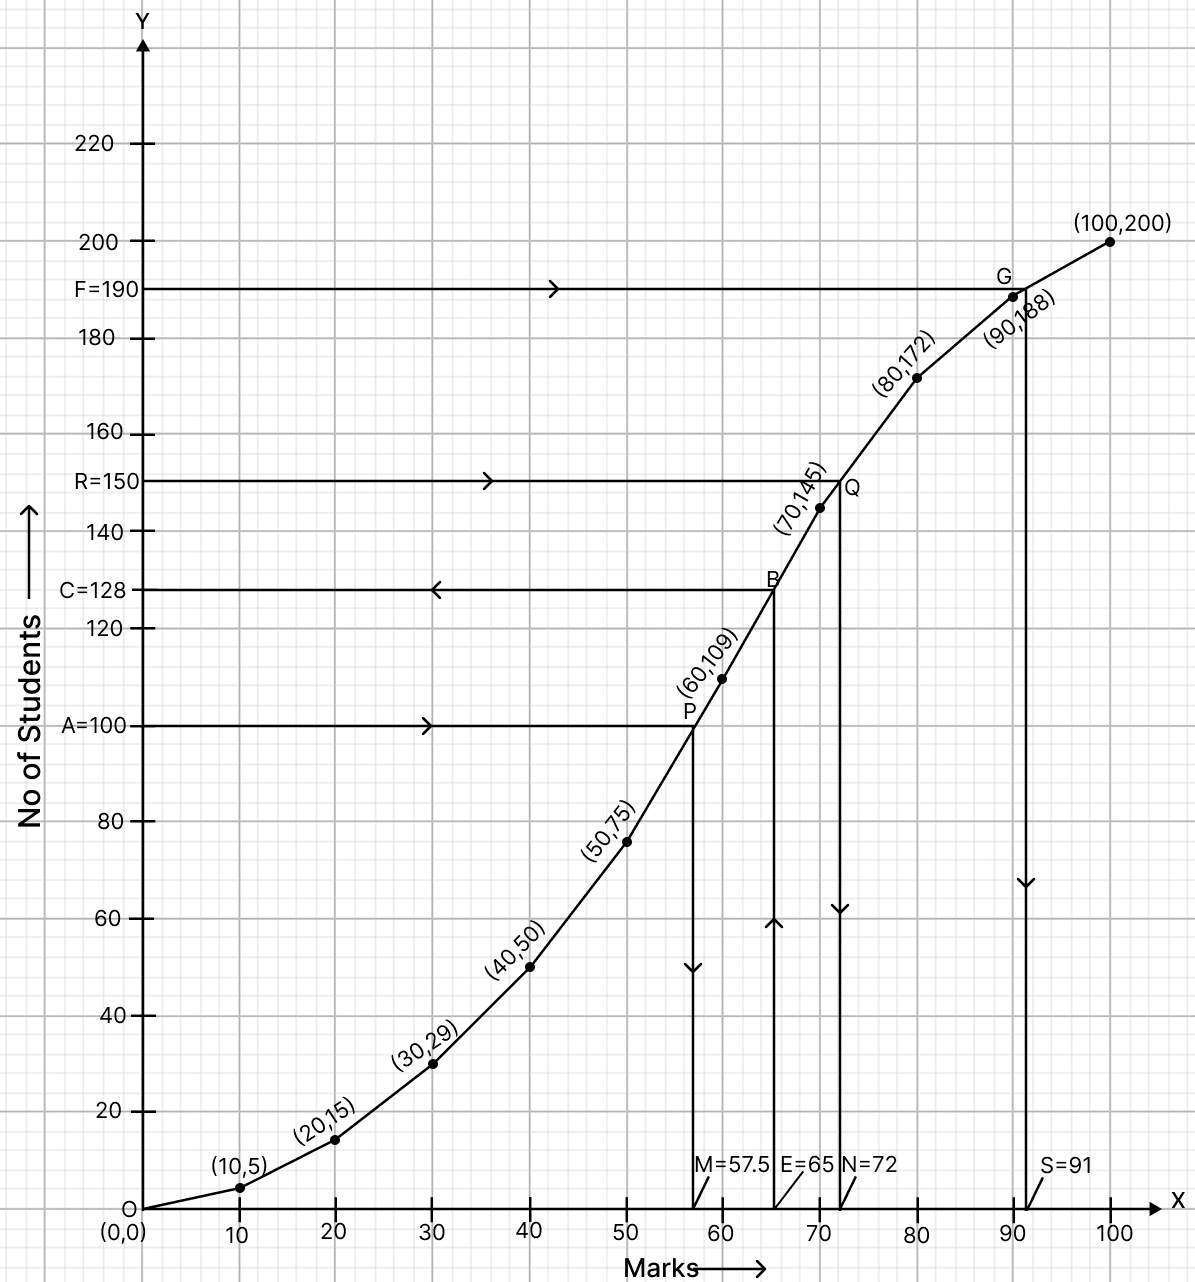
(i) To find the median :
Let A be the point on y-axis representing frequency = = 100.
Through A draw a horizontal line to meet the ogive at P. Through P, draw a vertical line to meet the x-axis at M. The abscissa of the points M represents 57.5.
Hence, the median is 57.5.
(ii) By formula,
Draw a line parallel to x-axis from point R (Number of students) = 150, touching the graph at point Q. From point Q draw a line parallel to y-axis touching x-axis at point N.
From graph,
N = 72
Hence, the upper quartile is 72.
(iii) Total marks = 100.
Let E be the point on x-axis representing marks = 65.
Through E draw a vertical line to meet the ogive at B. Through B, draw a horizontal line to meet the y-axis at C. The ordinate of the point C represents 128.
Hence, 128 students score less than or equal to 65, so, students scoring more than 65 = 200 - 128 = 72.
Hence, the number of students who scored more than 65 marks is 72.
(iv) Given, 10 students qualify for merit-scholarship. This corresponds to 190th student. Since, 200 - 10 = 190
Draw a line parallel to x-axis from point F = 190, touching the graph at point G. From point G draw a line parallel to y-axis touching x-axis at point S.
From graph,
S = 91
Hence, the minimum marks required to qualify is 91.
Answered By
1 Like
Related Questions
The following table shows the weights (in gm) of a sample of 100 apples, taken from a large consignment:
Weight (in gm) Number of apples 50 - 60 8 60 - 70 10 70 - 80 12 80 - 90 16 90 - 100 18 100 - 110 14 110 - 120 12 120 - 130 10 (i) Construct the cumulative frequency table
(ii) Draw the cumulative frequency curve on a graph paper and from it, determine the median weight of the apples.
Marks obtained by 200 students in an examination are given below:
Marks Number of students 0 - 10 5 10 - 20 11 20 - 30 10 30 - 40 20 40 - 50 28 50 - 60 37 60 - 70 40 70 - 80 29 80 - 90 14 90 - 100 6 Draw an ogive for the given distribution taking 1 cm = 10 marks on one axis and 2 cm = 20 students on other axis.
Using the graph, determine :
(i) The median marks
(ii) The number of students who failed, if minimum marks required to pass is 40.
(iii) If scoring 85 and more marks is considered as grade one, find the number of students who secured grade one in the examination.
The table below shows the distribution of the scores obtained by 120 shooters in shooting competition. Using a graph sheet, draw an ogive for the distribution.
Scores obtained Number of shooters 0 - 10 5 10 - 20 9 20 - 30 16 30 - 40 22 40 - 50 26 50 - 60 18 60 - 70 11 70 - 80 6 80 - 90 4 90 - 100 3 Use your ogive to estimate :
(i) the median
(ii) the inter-quartile range
(iii) the number of shooters who obtained more than 75% score.
The daily wages of 80 workers in a project are given below:
Wages (in ₹) Number of workers 400 - 450 2 450 - 500 6 500 - 550 12 550 - 600 18 600 - 650 24 650 - 700 13 700 - 750 5 Use a graph paper to draw an ogive for the above distribution. (Use a scale of 2 cm = ₹ 50 on x-axis and 2 cm = 10 workers on y-axis). Use your ogive to estimate:
(i) the median wage of the workers.
(ii) the lower quartile wage of the workers.
(iii) the number of workers who earn more than ₹ 625 daily.