Mathematics
The table given below shows the runs scored by a cricket team during the overs of a match.
| Overs | Runs scored |
|---|---|
| 20-30 | 37 |
| 30-40 | 45 |
| 40-50 | 40 |
| 50-60 | 60 |
| 60-70 | 51 |
| 70-80 | 35 |
(a) Draw a histogram representing the above distribution.
(b) Estimate the modal runs scored.
Answer
Steps :
Take 2 cm along x-axis = 10 overs and 1 cm along y-axis = 10 runs.
Since, the scale on x-axis starts at 20, a break (zig-zag curve) is shown near the origin along x-axis to indicate that the graph is drawn to scale beginning at 20 and not at origin itself.
Construct rectangles corresponding to the given data.
In highest rectangle, draw two st. lines KN and LI from corners of the rectangles on either side of the highest rectangle to the opposite corners of the highest rectangle. Let Z be the point of intersection of KN and LI.
Through Z, draw a vertical line to meet the x-axis at A. The abscissa of the point A represents 57.
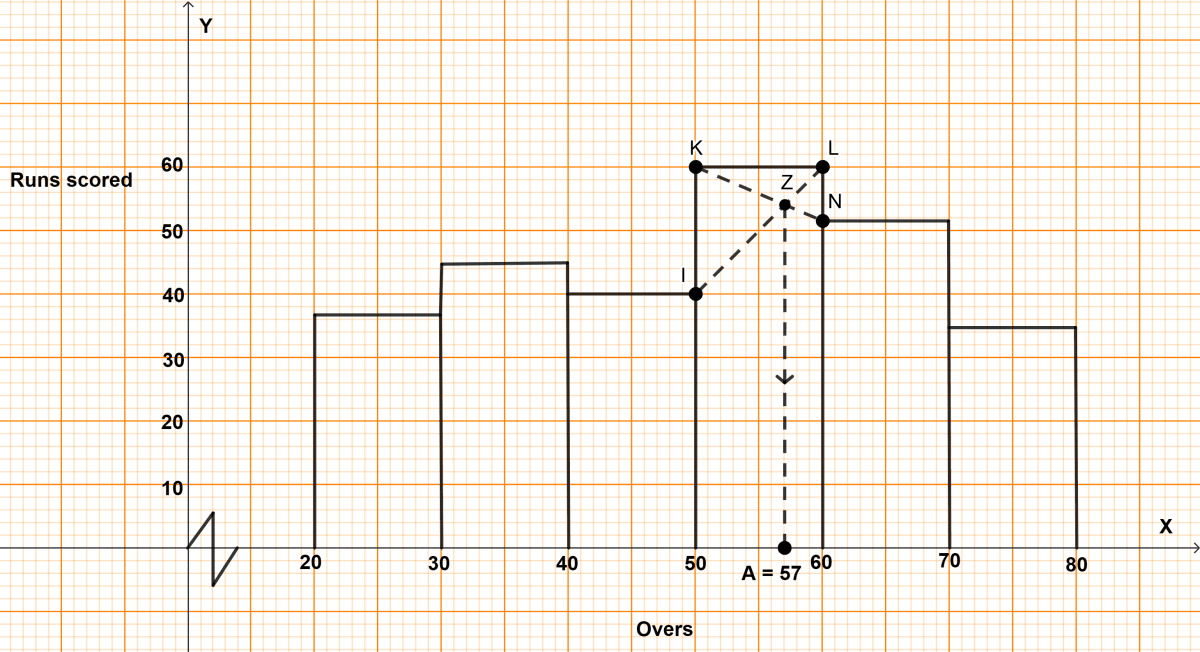
Hence, mode = 57.