Mathematics
By taking classes 30 - 40, 40 - 50, 50 - 60, ……………, construct a frequency table for the following data :
| 65 | 34 | 74 | 49 | 52 | 35 |
| 71 | 55 | 61 | 40 | 56 | 38 |
| 52 | 56 | 52 | 33 | 60 | 35 |
| 49 | 37 | 53 | 50 | 44 | 30 |
| 62 | 50 | 47 | 45 | 47 | 50 |
| 63 | 61 | 54 | 58 | 47 | 64 |
| 37 | 38 | 44 | 42 | 47 | 55 |
| 70 | 33 | 75 | 49 | 47 | 30 |
| 60 | 69 |
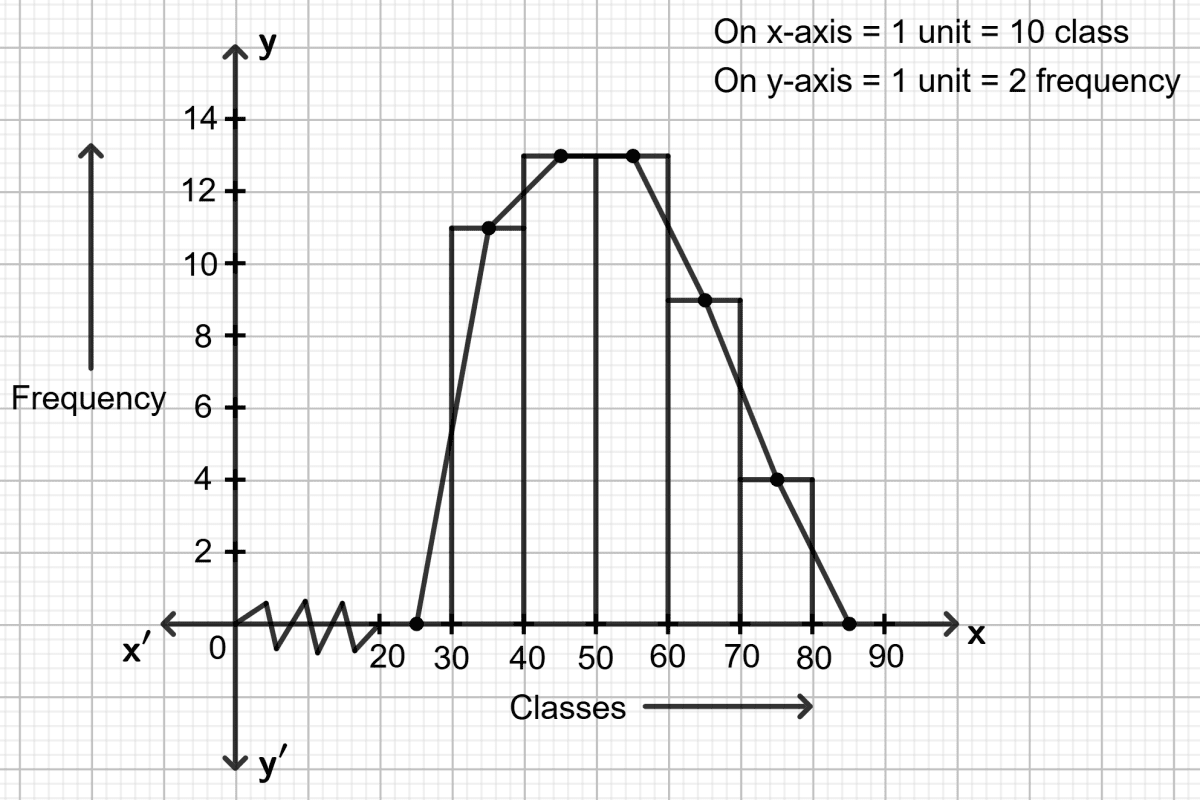
Also, construct a combined histogram and frequency polygon for the distribution.
Answer
The frequency table for the given distribution is :
| Classes | Tally marks | Frequency |
|---|---|---|
| 30 - 40 | 11 | |
| 40 - 50 | 13 | |
| 50 - 60 | 13 | |
| 60 - 70 | 9 | |
| 70 - 80 | IIII | 4 |
Steps:
1. Draw a histogram.
- On the x-axis, mark the class intervals: 30-40, 40-50, 50-60, 60-70 and 70-80.
- On the y-axis, mark the frequency values.
- Construct rectangles with class-intervals as bases and the corresponding frequencies as heights.
- Since the scale on x-axis starts at 30, a kink (break) or a zig-zag curve is shown near the origin to indicate that the graph is drawn to scale beginning at 30 and not at the origin itself.
2. Mark the mid-points at the top of each rectangle of the histogram drawn.
- 30−40 → 35
- 40−50 → 45
- 50−60 → 55
- 60−70 → 65
- 70−80 → 75
3. Also, mark the mid-point of the immediately lower class-interval ( in the given example, the immediately lower class-interval is 20-30) and mid-point of the immediately higher class-interval (in the given example the immediate upper class-interval is 80-90).
4. Join the consecutive mid-points marked by straight lines to obtain the required frequency polygon.
Related Questions
The cost of 250 articles is given below :
Cost (in ₹) No. of articles less than 20 22 less than 30 40 less than 40 75 less than 50 190 less than 60 228 less than 70 250 Construct a frequency distribution table for the data given above. Also, answer the following :
(i) how many articles cost from ₹ 30 to less than ₹ 50 ?
(ii) how many articles have cost at most ₹ 40?
(iii) how many articles have cost at least ₹ 50?
The class marks of a distribution are 62, 67, 72, 77, 82 and 87. Find the class-size and class-limits.
State, which of the following variables are continuous and which are discrete :
(i) marks scored in a test.
(i1) daily temperature of a city.
(iii) sizes of shoes.
(iv) distance covered by a train.
(v) time.
The table, given below, shows the frequency distribution of the weekly wages of the employees of a company :
Weekly Wages (in ₹) Number of employees 800 - 899 22 900 - 999 27 1000 - 1099 23 1100 - 1199 18 1200 - 1299 15 Find :
(i) the lower limit of the fourth class.
(ii) the upper limit of the fifth class.
(iii) the class boundaries of the second class.
(iv) the class mark of the first class.
(v) the class size of the third class.
(vi) cumulative frequency of the fourth class.