
Mathematics
The monthly income of a group of 320 employees in a company is given below :
| Monthly income | No. of employees |
|---|---|
| 6 - 7 | 20 |
| 7 - 8 | 45 |
| 8 - 9 | 65 |
| 9 - 10 | 95 |
| 10 - 11 | 60 |
| 11 - 12 | 30 |
| 12 - 13 | 5 |
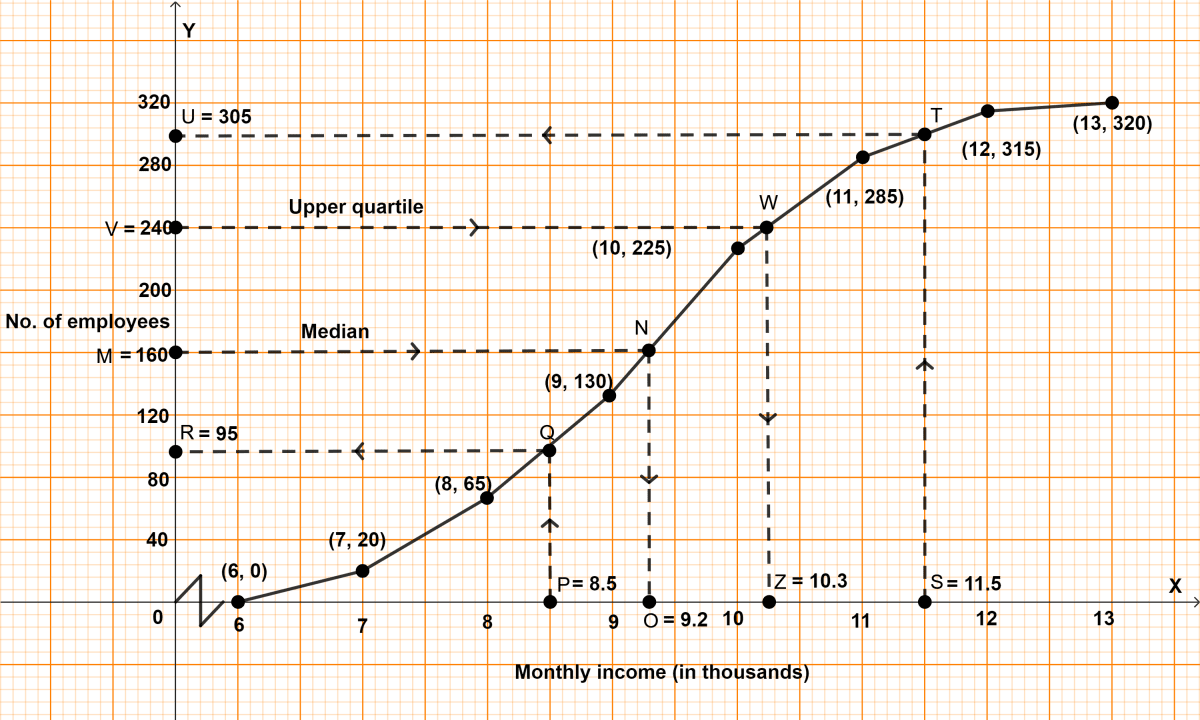
Draw an ogive of the given distribution on a graph sheet taking 2 cm = ₹ 1000 on one axis and 2 cm = 50 employees on the other axis. From the graph determine :
(i) the median wage.
(ii) the number of employees whose income is below ₹ 8500.
Measures of Central Tendency
22 Likes
Answer
(i) Cumulative frequency distribution table :
| Monthly income | No. of employees | Cumulative frequency |
|---|---|---|
| 6 - 7 | 20 | 20 |
| 7 - 8 | 45 | 65 (20 + 45) |
| 8 - 9 | 65 | 130 (65 + 65) |
| 9 - 10 | 95 | 225 (130 + 95) |
| 10 - 11 | 60 | 285 (225 + 60) |
| 11 - 12 | 30 | 315 (285 + 30) |
| 12 - 13 | 5 | 320 (315 + 5) |
Here, n = 320, which is even.
By formula,
Median = th term
= = 160th term.
Steps of construction :
Since, the scale on x-axis starts at 6, a break (kink) is shown near the origin on x-axis to indicate that the graph is drawn to scale beginning at 6.
Take 2 cm along x-axis = 1 thousand rupees.
Take 1 cm along y-axis = 40 employees.
Plot the point (6, 0) as ogive starts from x-axis representing lower limit of first class.
Plot the points (7, 20), (8, 65), (9, 130), (10, 225), (11, 285), (12, 315) and (13, 320).
Join the points by a free hand curve.
Draw a line parallel to x-axis from point M (no. of employees) = 160, touching the graph at point N. From point N draw a line parallel to y-axis touching x-axis at point O.
From graph, O = 9.2 (thousands)
Hence, median = ₹ 9200.
(ii) Draw a line parallel to y-axis from point P (income) = ₹ 8.5 (thousands), touching the graph at point Q. From point Q draw a line parallel to x-axis touching y-axis at point R.
From graph, R = 95.
Hence, 95 employees have income less than ₹ 8500.
Answered By
12 Likes
Related Questions
Using a graph paper, draw an ogive for the following distribution which shows a record of the weight in kilograms of 200 students.
Weight Frequency 40 - 45 5 45 - 50 17 50 - 55 22 55 - 60 45 60 - 65 51 65 - 70 31 70 - 75 20 75 - 80 9 Use your ogive to estimate the following :
(i) The percentage of students weighing 55 kg or more.
(ii) The weight above which the heaviest 30% of the students fall,
(iii) The number of students who are (a) under-weight and (b) over weight, if 55.70 kg is considered as standard weight ?
The distribution given below, shows the marks obtained by 25 students in an aptitude test. Find the mean, median and mode of the distribution.
Marks obtained No. of students 5 3 6 9 7 6 8 4 9 2 10 1 The mean of numbers 45, 52, 60, x, 69, 70, 26, 81 and 94 is 68. Find the value of x. Hence, estimate the median for the resulting data.
The marks of 10 students of a class in an examination arranged in ascending order is as follows :
13, 35, 43, 46, x, x + 4, 55, 61, 71, 80.
If the median marks is 48, find the value of x. Hence, find the mode of the given data.