Mathematics
Use a graph paper for this question. (Take 2 cm = 10 Marks along one axis and 2 cm = 10 students along another axis). Draw a Histogram for the following distribution which gives the marks obtained by 164 students in a particular class and hence find the Mode.
| Marks | Number of students |
|---|---|
| 30 - 40 | 10 |
| 40 - 50 | 26 |
| 50 - 60 | 40 |
| 60 - 70 | 54 |
| 70 - 80 | 34 |
Answer
Steps of Construction:
Draw a histogram of the given distribution.
Inside the highest rectangle, which represents the maximum frequency (the modal class 60–70), draw two lines AC and BD diagonally from the upper corners C and D of the adjacent rectangles to the top corners of the modal rectangle.
Through the point K (the point of intersection of diagonals AC and BD), draw KL perpendicular to the horizontal axis (Marks axis).
The value of point L on the horizontal axis represents the value of the mode.
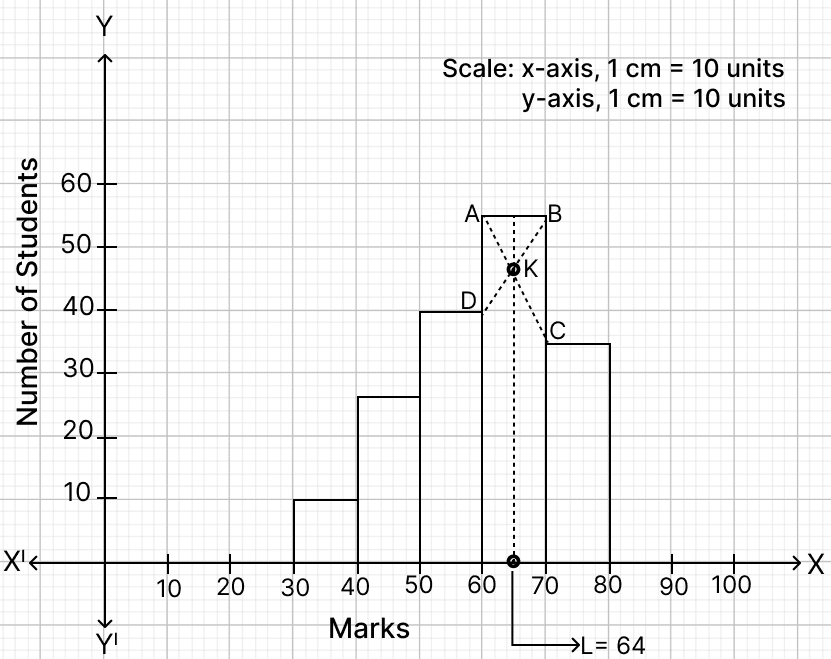
From graph,
The Mode = L = 64 marks (approx.)
Hence, mode = 64.
Related Questions
Use a graph paper for this question taking 2 cm = 1 unit along both axes.
(a) Plot A(1, 3), B(1, 2) and C(3, 0).
(b) Reflect A and B on the x-axis and name their images as E and D respectively. Write down their coordinates.
(c) Reflect A and B through the origin and name their images as F and G respectively.
(d) Reflect A, B and C on the y-axis and name their images as J, I and H respectively.
(e) Join all the points A, B, C, D, E, F, G, H, I and J in order and name the closed figure so formed.
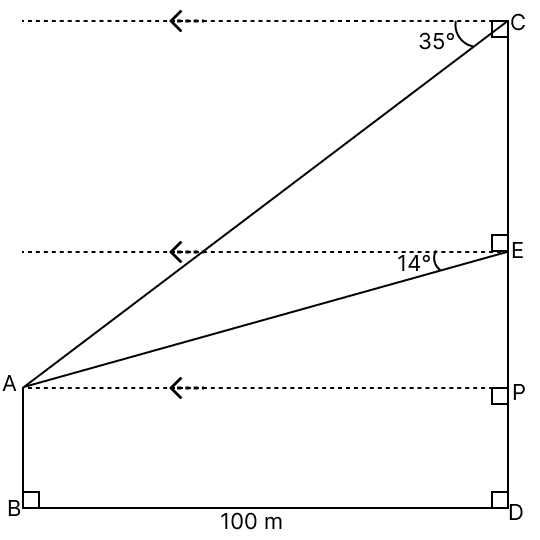
In the given diagram, AB is a vertical tower 100 m away from the foot of a 30 storied building CD. The angles of depression from the point C and E, (E being the mid-point of CD), are 35° and 14° respectively. (Use mathematical table for the required values rounded off correct to two places of decimals only.)
Find the height of the:
(a) tower AB
(b) building CD
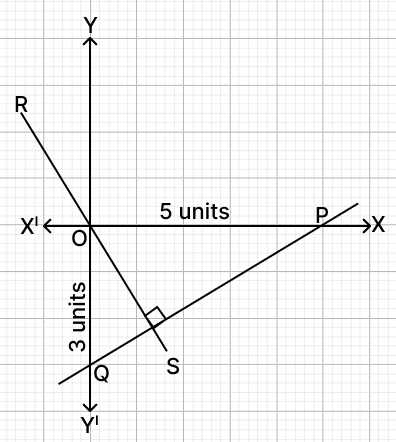
In the given graph, P and Q are points such that PQ cuts off intercepts of 5 units and 3 units along the x-axis and y-axis respectively. Line RS is perpendicular to PQ and passes through the origin. Find the:
(a) coordinates of P and Q
(b) equation of line RS
Refer to the given bill. A customer paid ₹2,000 (rounded off to the nearest ₹10) to clear the bill.
Note: 5% discount is applicable on an article if 10 or more such articles are purchased.
Article M.P.(₹) Quantity G.S.T A 190 06 12% B 50 12 18% Check whether the total amount paid by the customer is correct or not. Justify your answer with necessary working.