
The range of the data given below, is
16, 5, 27, 15, 11, 56, 28, 17, 35, 8, 43
- 5
- 28
- 51
- 56
Answer
Range = Highest observation - Lowest observation
= 56 - 5
= 51
Hence, option 3 is the correct option.
The mean of n observations x1, x2, ..............., xn is equal to
- n∑xi
- n∑xi2
- ∑xi
Answer
The mean of n observations x1, x2, ..............., xn is given by :
Mean =
Hence, option 4 is the correct option.
For n observations arranged in an array, if n is odd, then median is the value of ............... observation.
Answer
When n is odd, then :
Median = value of observation.
Hence, option 2 is the correct option.
The Empirical formula for calculating mode is
- Mode = Mean + Median
- Mode = 3(Median) - 2 (Mean)
- Mode = 2(Median) - 3 (Mean)
- Mode = Median + 3(Mean)
Answer
The Empirical formula for calculating mode is :
Mode = 3(Median) - 2(Mean)
Hence, option 2 is the correct option.
The median of the first 49 natural numbers is
- 24
- 24.5
- 25
- 25.5
Answer
The first 49 natural numbers are :
1, 2, 3, 4, ............, 49
Number of observations, n = 49 (odd)
Median = term
= term
= term
= term
= 25
Hence, option 3 is the correct option.
Fill in the blanks :
(i) A collection of information in the form of numerical figures, is called ............... .
(ii) When information is collected and presented, randomly, then it is called ............... data.
(iii) A particular observation that gives the value of a variable is called ............... .
(iv) An arrangement of the numerical figures of a data in ascending or descending order is called an ............... .
(v) The difference between the highest and the lowest values of observations in a data is called the ............... of the data.
(vi) The number of times a particular observation occurs in a data is called the ............... of the observation.
(vii) The representation of data in a tabular form showing the frequency of each observation is called ............... .
(viii) The arithmetic mean of some observations is equal to the ratio of the sum of the observations to the ............... .
(ix) When an ungrouped data is arranged in an array, then the value of the ............... observation is called the median of the data.
(x) The value of the variable which occurs most frequently is called the ............... of the data.
Answer
(i) A collection of information in the form of numerical figures, is called data.
(ii) When information is collected and presented, randomly, then it is called raw data.
(iii) A particular observation that gives the value of a variable is called variate.
(iv) An arrangement of the numerical figures of a data in ascending or descending order is called an array.
(v) The difference between the highest and the lowest values of observations in a data is called the range of the data.
(vi) The number of times a particular observation occurs in a data is called the frequency of the observation.
(vii) The representation of data in a tabular form showing the frequency of each observation is called frequency distribution.
(viii) The arithmetic mean of some observations is equal to the ratio of the sum of the observations to the number of observations.
(ix) When an ungrouped data is arranged in an array, then the value of the middle-most observation is called the median of the data.
(x) The value of the variable which occurs most frequently is called the mode of the data.
Write true (T) or false (F) :
(i) Each entry in a raw data is called an observation.
(ii) Highest observation — Lowest observation gives the frequency.
(iii) Mean of first 4 multiples of 2 is 4.
(iv) The observation which occurs most frequently in a data is called the mode.
(v) The median of first 10 natural numbers is 5.5.
Answer
(i) True
Reason — Each numerical figure in a data is called an observation.
(ii) False
Reason — The difference between the highest and the lowest values of observations gives the range of the data, not the frequency.
(iii) False
Reason — The first 4 multiples of 2 are 2, 4, 6 and 8.
Mean =
=
= 5
So, the mean of first 4 multiples of 2 is 5, not 4.
(iv) True
Reason — By definition, mode is the value of the variable which occurs most frequently in a given data.
(v) True
Reason — The first 10 natural numbers are 1, 2, 3, 4, 5, 6, 7, 8, 9, 10.
Number of observations, n = 10 (even)
Median = term
In India, the Census is held every 10 years to count the whole population of the country. In a particular Census, the data of the number of children in 25 families of a village was provided as :
1, 2, 4, 2, 0, 2, 3, 3, 1, 0, 2, 3, 4, 3, 1, 1, 2, 1, 2, 3, 2, 4, 1, 2, 2.
Rahul works in the analytics department of the Census. He was given the task of analysing this data of the 25 families of this village.
(1) How many families have 3 children ?
- 2
- 3
- 5
- 6
(2) The cumulative frequency of families having 3 children is :
- 13
- 17
- 18
- 22
(3) The mean number of children in these 25 families is :
- 1.96
- 2.04
- 2.85
- 3.15
(4) The median of the number of children in these 25 families is :
- 1
- 2
- 3
- 4
Answer
Arranging the given data in ascending order, we get :
0, 0, 1, 1, 1, 1, 1, 1, 2, 2, 2, 2, 2, 2, 2, 2, 2, 3, 3, 3, 3, 3, 4, 4, 4
We prepare the following table :
| Number of children (xi) | Number of families (fi) | Cumulative Frequency | fixi |
|---|---|---|---|
| 0 | 2 | 2 | 0 |
| 1 | 6 | 8 | 6 |
| 2 | 9 | 17 | 18 |
| 3 | 5 | 22 | 15 |
| 4 | 3 | 25 | 12 |
| Total | N = ∑fi = 25 | ∑fixi = 51 |
(1) From the table, the number of families having 3 children = 5.
Hence, option 3 is the correct option.
(2) From the table, the cumulative frequency of families having 3 children = 22.
Hence, option 4 is the correct option.
(3) Mean =
=
= 2.04
Hence, option 2 is the correct option.
(4) We have, N = 25, which is odd.
Median = term
[Note that each one of 9th, 10th, ......, 17th term is 2.]
Hence, option 2 is the correct option.
Anoop owns an air conditioner shop. In a year, six months beginning from April are the most important months of his business. Maximum number of air conditions sell during these months. He plotted a bar graph of his sales during the period from April to September in the year 2021.
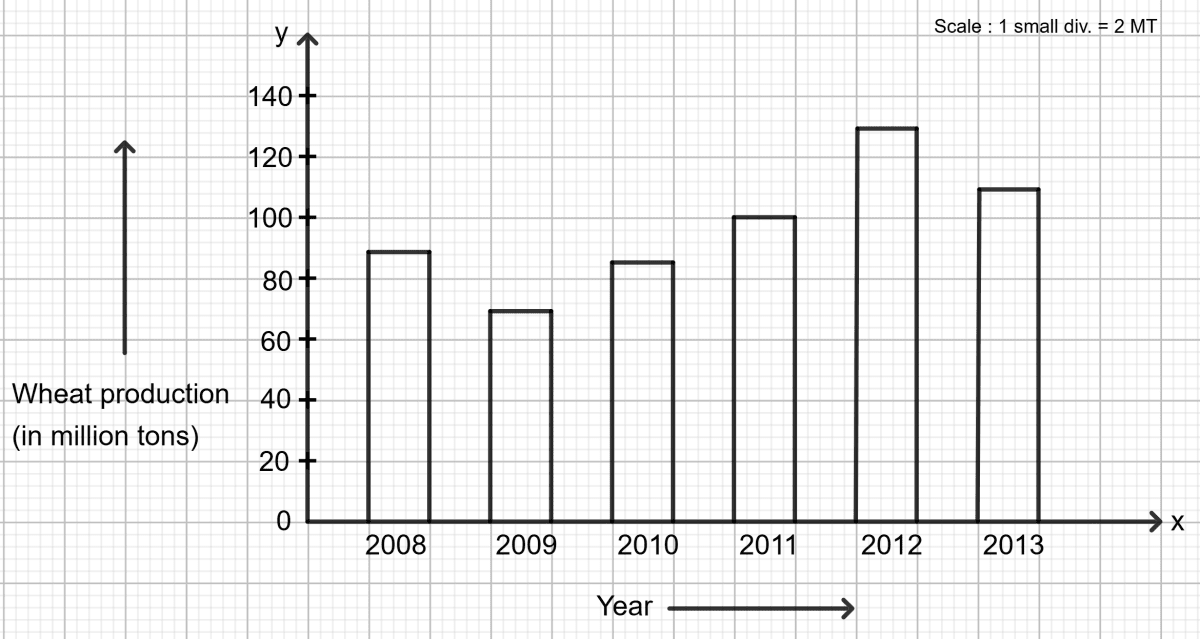
(1) Anoop's shop sold the highest number of air conditioners in the month of :
- June
- July
- August
- September
(2) The difference between the number of air conditioners sold in June and August is :
- 40
- 60
- 70
- 130
(3) The total number of air conditioners sold in this period of six months is :
- 3280
- 3560
- 3710
- 3930
(4) The ratio between the highest number of air conditioners sold in a month to the lowest number of air conditioners sold in a month during this period is :
- 51 : 46
- 36 : 23
- 24 : 17
- 34 : 23
Answer
From the given bar graph, the number of air conditioners sold in different months are :
April = 510, May = 460, June = 640, July = 720, August = 680, September = 550.
(1) The highest number of air conditioners sold = 720, which is in the month of July.
Hence, option 2 is the correct option.
(2) Difference between the number of air conditioners sold in June and August
= 680 - 640
= 40
Hence, option 1 is the correct option.
(3) Total number of air conditioners sold in six months
= 510 + 460 + 640 + 720 + 680 + 550
= 3560
Hence, option 2 is the correct option.
(4) Highest number of air conditioners sold in a month = 720 (in July)
Lowest number of air conditioners sold in a month = 460 (in May)
Required ratio = 720 : 460
=
=
= 36 : 23
Hence, option 2 is the correct option.
Assertion: If the extreme observations on both the ends of a data arranged in ascending order are removed, the median does not get affected.
Reason: Mode is the value of the variable which occurs most frequently.
- Both Assertion (A) and Reason (R) are true and Reason (R) is the correct explanation of Assertion (A).
- Both Assertion (A) and Reason (R) are true but Reason (R) is not the correct explanation of Assertion (A).
- Assertion (A) is true but Reason (R) is false.
- Assertion (A) is false but Reason (R) is true.
Answer
Both Assertion (A) and Reason (R) are true but Reason (R) is not the correct explanation of Assertion (A).
Explanation
The median is the value of the middle-most observation when the data is arranged in ascending order. If we remove one extreme observation from each end of the data, the middle-most observation remains the same. So, the median does not get affected.
Hence, Assertion is true.
By definition, mode is the value of the variable which occurs most frequently in a given data.
Hence, Reason is true.
However, Reason is about mode, while Assertion is about median. So, Reason is not the correct explanation of Assertion.
Hence, option 2 is the correct option.
Assertion: Mean of the observations can be lesser than each of the given observations.
Reason: Mean of n observations x1, x2, x3 ............... xn is given by .
- Both Assertion (A) and Reason (R) are true and Reason (R) is the correct explanation of Assertion (A).
- Both Assertion (A) and Reason (R) are true but Reason (R) is not the correct explanation of Assertion (A).
- Assertion (A) is true but Reason (R) is false.
- Assertion (A) is false but Reason (R) is true.
Answer
Assertion (A) is false but Reason (R) is true.
Explanation
The mean of given observations always lies between the lowest and the highest observations. So, the mean cannot be less than each of the given observations.
Hence, Assertion is false.
The mean of n observations x1, x2, x3, ............... xn is given by .
Hence, Reason is true.
Hence, option 4 is the correct option.
In the past 10 days, the average temperature on one of the days was much lower than on the rest of the days. Given the data for the average daily temperature of the past 10 days, which statistic can be used to find the central value of the data?
- mean
- median
- mode
- range
Answer
One day's temperature is much lower than the others, so it is an outlier.
The mean gets affected by extreme values.
The median represents the middle value and is not much affected by outliers.
The mode is the most frequent value.
The range measures spread, not the central value.
Therefore, the best statistic to find the central value is median.
Hence, option 2 is the correct option.
There were 12 tests conducted in a semester. Anupam created a bar graph to represent the rank he secured on each test. The information gathered from the bar graph is given below.
- Anupam secured the first rank twice.
- Anupam secured the fifth rank 6 times.
- Anupam secured the third rank 3 times.
- Anupam secured the fourth rank only once.
Which question can be answered using the mode of the data on the bar graph?
- Which rank did Anupam secure the most?
- How many times did Anupam secure the fourth rank?
- Which rank did Anupam secure least number of times?
- None of these
Answer
Mode is the value (here, the rank) which occurs most frequently in the data.
From the given information, the number of times Anupam secured each rank is :
- First rank → 2 times
- Third rank → 3 times
- Fourth rank → 1 time
- Fifth rank → 6 times
The fifth rank occurs the most number of times (6 times), so the mode of the data is the fifth rank.
Thus, the mode tells us the rank which Anupam secured the most number of times. So, the question "Which rank did Anupam secure the most?" can be answered using the mode of the data.
Hence, option 1 is the correct option.
If the arithmetic mean of runs scored by Sunil in 11 matches is 49, then the runs scored by him in 11th match is:
| Number of matches | 1 | 2 | 3 | 4 | 5 | 6 | 7 | 8 | 9 | 10 | 11 |
|---|---|---|---|---|---|---|---|---|---|---|---|
| Runs scored | 84 | 80 | 0 | 10 | 60 | 75 | 50 | 100 | 20 | 40 | x |
- 20
- 40
- 80
- 50
Answer
Given,
Arithmetic mean of runs scored in 11 matches = 49
Number of matches (observations) = 11
Runs scored in the 11th match = x
Sum of all observations = 84 + 80 + 0 + 10 + 60 + 75 + 50 + 100 + 20 + 40 + x
= 519 + x
Mean =
⇒ 49 =
⇒ 49 × 11 = 519 + x
⇒ 539 = 519 + x
⇒ x = 539 - 519
⇒ x = 20
So, the runs scored by Sunil in the 11th match is 20.
Hence, option 1 is the correct option.
Read the statements carefully and select the correct option.
Statement-1 : Mode is most frequently occurring value in a given data. It is always less than the median of the data.
Statement-2 : Median of the data (1, 2, 2, 3, 2, 3, 4, 2, 3, 2, 2, 3, 2, 1, 2, 2, 3, 2, 3, 3, 2, 3, 3, 3) is less than the mode.
- Statement-1 is true and Statement-2 is false.
- Statement-1 is false and Statement-2 is true.
- Both Statement-1 and Statement-2 are false.
- Both Statement-1 and Statement-2 are true.
Answer
Statement-1 : Mode is the most frequently occurring value in a given data — this part is correct. But the mode is not always less than the median. The mode may be less than, equal to or greater than the median, depending on the data.
So, Statement-1 is false.
Statement-2 : The given data is :
1, 2, 2, 3, 2, 3, 4, 2, 3, 2, 2, 3, 2, 1, 2, 2, 3, 2, 3, 3, 2, 3, 3, 3
Arranging the data in ascending order, we get :
1, 1, 2, 2, 2, 2, 2, 2, 2, 2, 2, 2, 2, 3, 3, 3, 3, 3, 3, 3, 3, 3, 3, 4
We prepare the following frequency table :
| Observation (xi) | Frequency (fi) | Cumulative Frequency |
|---|---|---|
| 1 | 2 | 2 |
| 2 | 11 | 13 |
| 3 | 10 | 23 |
| 4 | 1 | 24 |
| Total | N = ∑fi = 24 |
Mode = 2, since 2 occurs the most number of times (11 times).
Number of observations, N = 24, which is even.
Median =
So, Median = 2 and Mode = 2, i.e., the median is equal to the mode and not less than the mode.
So, Statement-2 is false.
Since both Statement-1 and Statement-2 are false,
Hence, option 3 is the correct option.
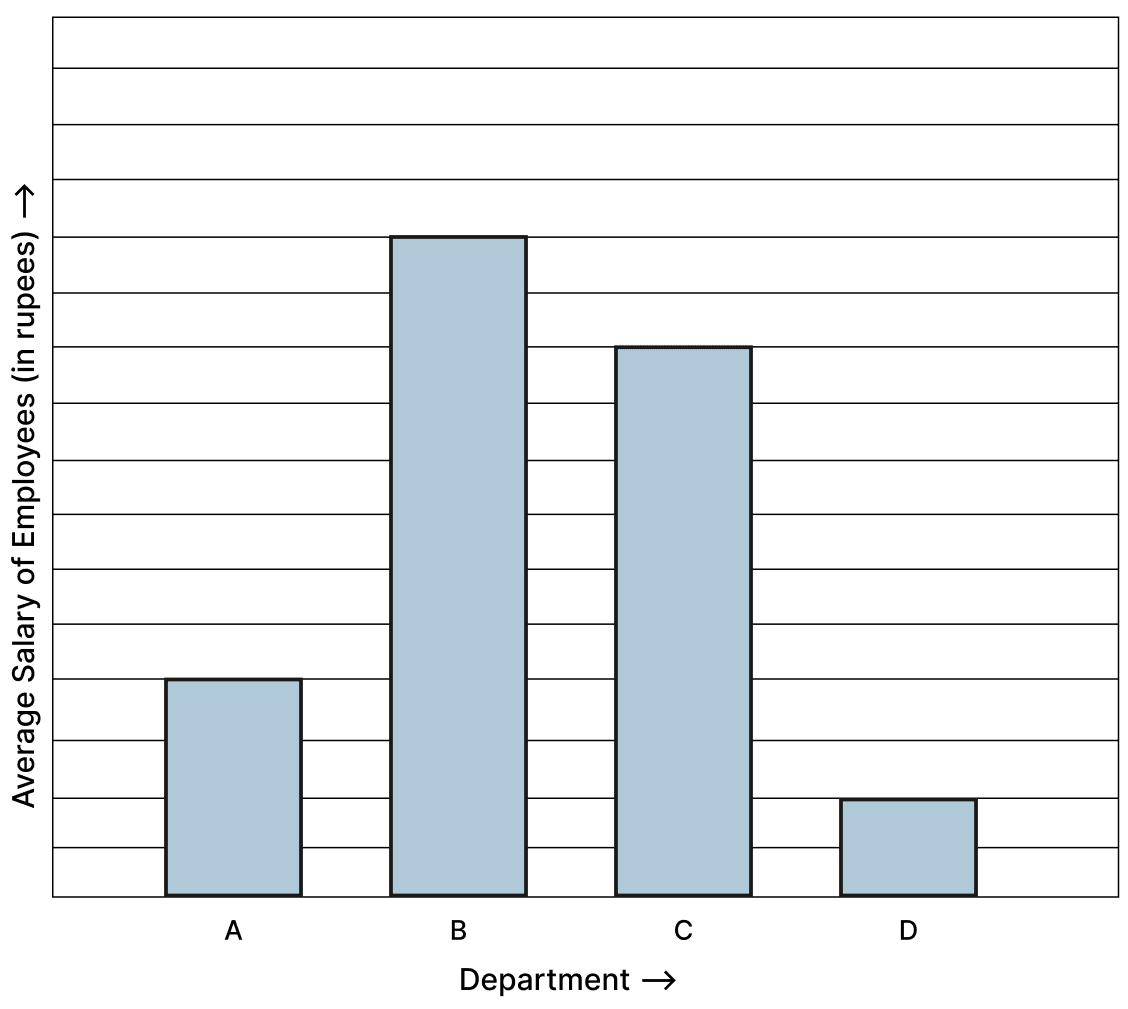
The bar graph displays the average salary of employees based on their department. If the difference in the average salary of an employee in Department B and Department D is ₹40,000, what must be the scale of the bar graph?
- 1 unit = ₹100
- 1 unit = ₹400
- 1 unit = ₹1000
- 1 unit = ₹4000
Answer
From the given bar graph, the heights of the bars (in units) for the different departments are :
Department A = 4 units, Department B = 12 units, Department C = 10 units, Department D = 2 unit.
Difference in the heights of the bars for Department B and Department D
= 12 units - 2 unit
= 10 units
Given, the difference in the average salary of an employee in Department B and Department D = ₹40,000.
So, 10 units = ₹40,000
⇒ 1 unit =
⇒ 1 unit = ₹4,000
Hence, option 4 is the correct option.