
Mathematics
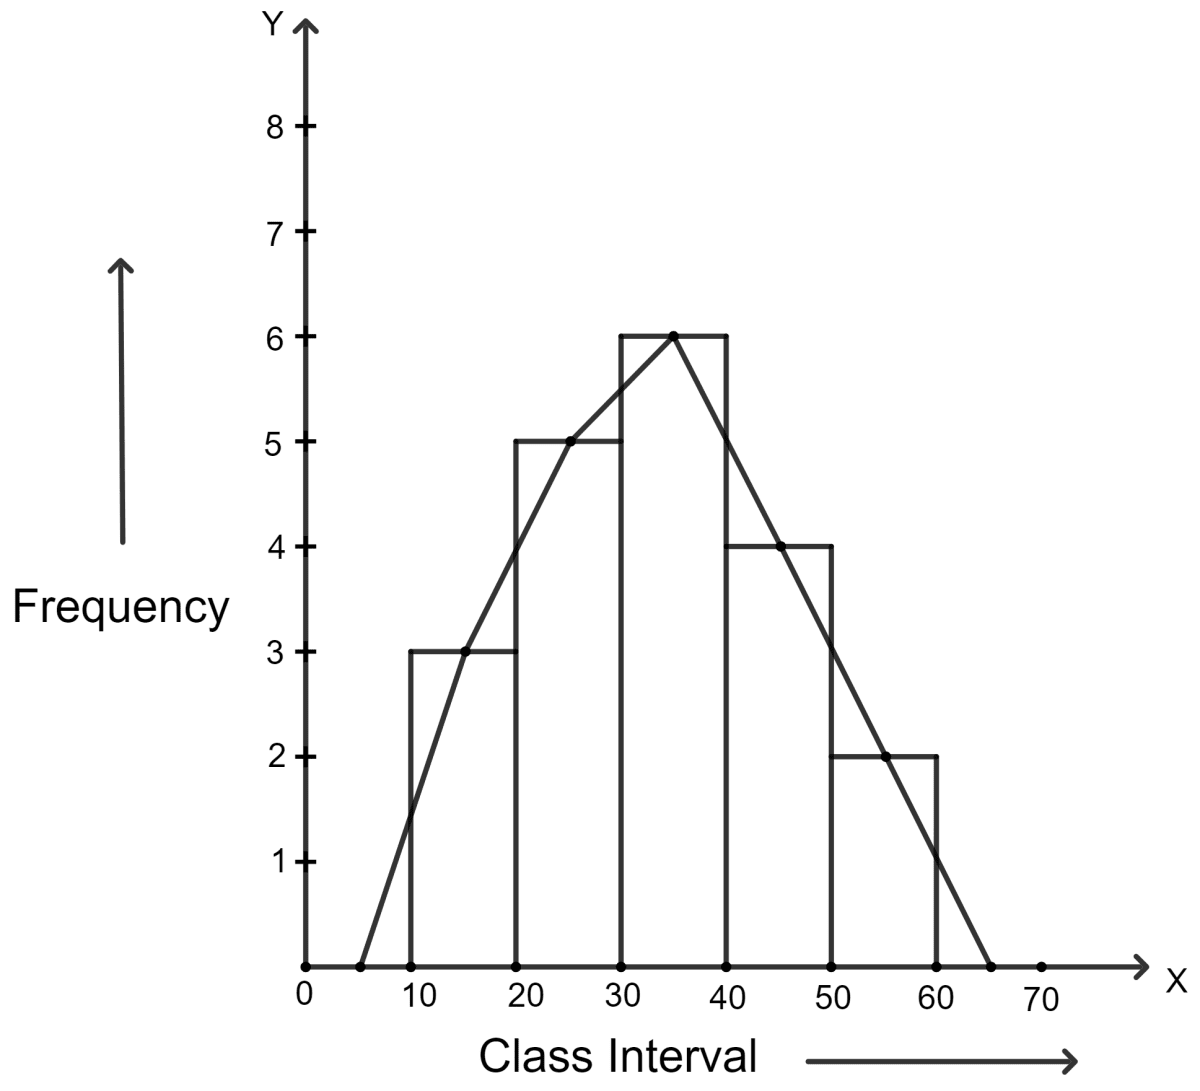
Construct a combined histogram and frequency polygon for the following frequency distribution :
| Class-intervals | 10 - 20 | 20 - 30 | 30 - 40 | 40 - 50 | 50 - 60 |
|---|---|---|---|---|---|
| Frequency | 3 | 5 | 6 | 4 | 2 |
Statistics
48 Likes
Answer
Steps:
Draw a histogram for the given data.
Mark the mid-point at the top of each rectangle of the histogram drawn.
Also, mark the mid-point of the immediately lower class-interval (in the given question, the immediately lower class-interval is 0 - 10) and mid-point of the immediately higher class-interval (in the given question the immediate upper class-interval is 60 - 70).
Join the consecutive mid-points marked by straight lines to obtain the required frequency polygon.
Answered By
33 Likes
Related Questions
Construct a frequency distribution table from the following cumulative frequency distribution:
(i)
Class Interval Cumulative Frequency 10 - 19 8 20 - 29 19 30 - 39 23 40 - 49 30 (ii)
C.I. C.F. 5 - 10 18 10 - 15 30 15 - 20 46 20 - 25 73 25 - 30 90 Construct a frequency polygon for the following distribution :
Class-intervals 0 - 4 4 - 8 8 - 12 12 - 16 16 - 20 20 - 24 Frequency 4 7 10 15 11 6 Construct a frequency polygon for the following data :
Class-intervals 10 - 14 15 - 19 20 - 24 25 - 29 30 - 34 Frequency 5 8 12 9 4 The daily wages in a factory are distributed as follows :
Daily wages (in ₹) 125 - 175 175 - 225 225 - 275 275 - 325 325 - 375 Number of workers 4 20 22 10 6 Draw a frequency polygon for this distribution.