
Mathematics
Draw the graph of the equation
4x + 3y + 6 = 0
From the graph, find :
(i) y1, the value of y, when x = 12
(ii) y2, the value of y, when x = -6
Graphical Solution
13 Likes
Answer
Step 1:
Give at least three suitable values to the variable x and find the corresponding values of y.
Let x = -3, then 4 (-3) + 3y + 6 = 0 ⇒ y = 2
Let x = 0, then 4 0 + 3y + 6 = 0 ⇒ y = -2
Let x = 3, then 4 3 + 3y + 6 = 0 ⇒ y = -6
Let x = 8, then 4 8 + 3y + 6 = 0 ⇒ y = -12.6
Step 2:
Make a table (as given below) for the different pairs of the values of x and y:
| x | -3 | 0 | 3 | 8 |
|---|---|---|---|---|
| y | 2 | -2 | -6 | -12.6 |
Step 3:
Plot the points, from the table, on a graph paper and then draw a straight line AB passing through the points plotted on the graph.
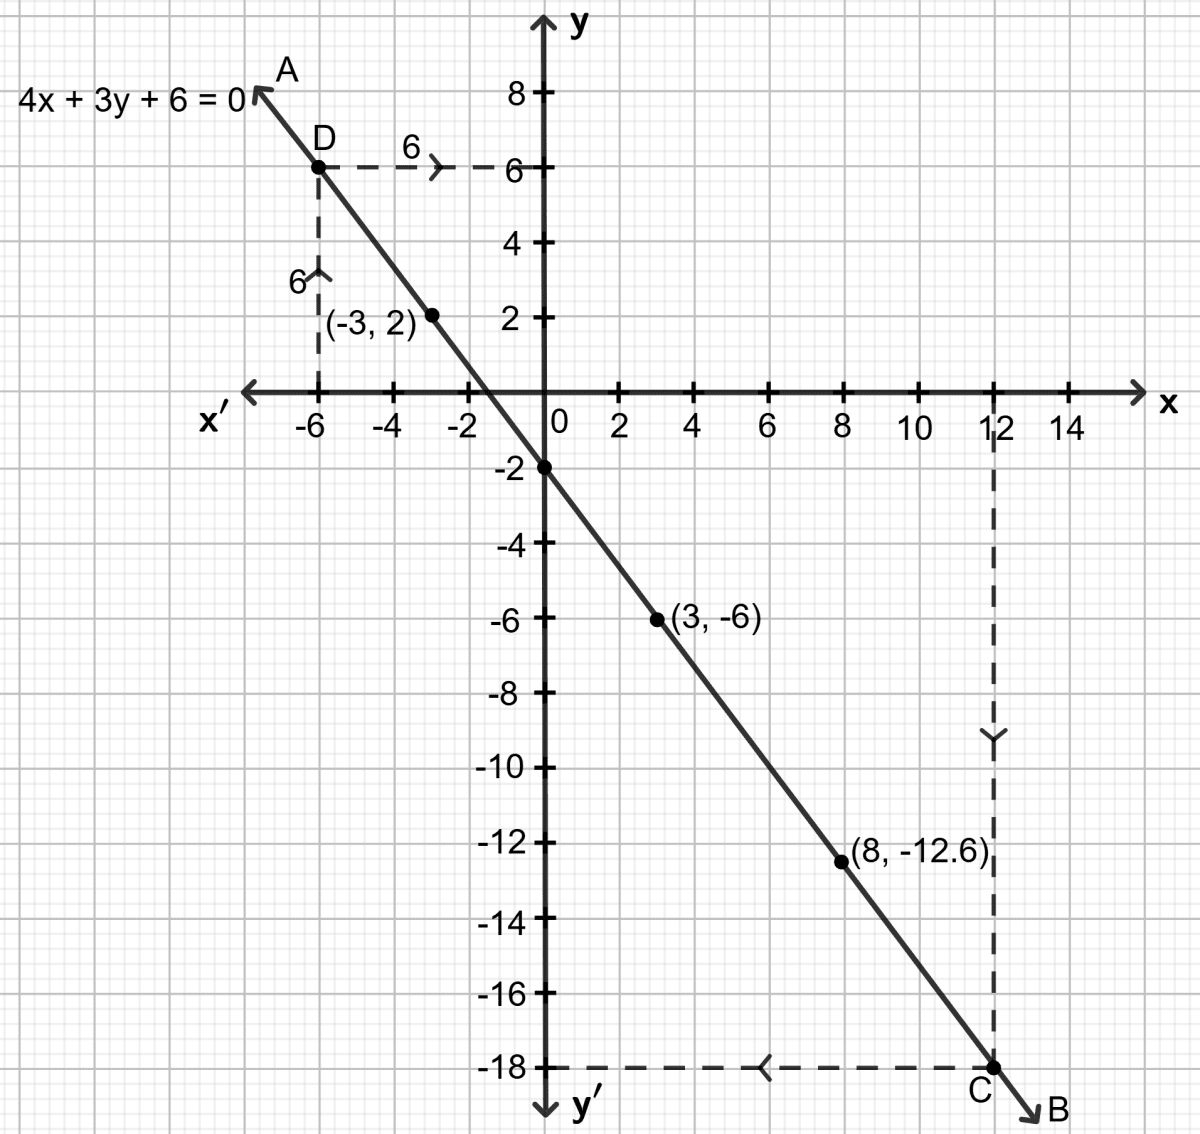
(i) To find y1, the value of y, when x = 12:
Through the point x = 12, draw a vertical straight line which meets the line AB at point C.
Through point C, draw a horizontal line which meets the y-axis at y = -18.
Hence, the value of y, when x = 12 is -18 , i.e, y1 = -18.
(ii) To find y2, the value of y, when x = -6:
Through the point x = -6, draw a vertical straight line which meets the line AB at point D.
Through point D, draw a horizontal line which meets the y-axis at y = 6.
Hence, the value of x, when y = -5 is 6, i.e, y2 = 6.
Answered By
4 Likes
Related Questions
Draw the graph of the straight line given by the equation 4x - 3y + 36 = 0
Calculate the area of the triangle formed by the line drawn and the co-ordinate axes.
Draw the graph of the equation
2x - 3y - 5 = 0
From the graph, find :
(i) x1, the value of x, when y = 7
(ii) x2, the value of x, when y = -5
Use the table given below to draw the graph.
x -5 -1 3 b 13 y -2 a 2 5 7 From your graph, find the values of 'a' and 'b'. State a linear relation between the variables x and y.
Draw the graph obtained from the table below :
x a 3 -5 5 c -1 y -1 2 b 3 4 0 Use the graph to find the values of a, b and c. State a linear relation between the variables x and y.