
Mathematics
Find the mode of the following distribution by drawing a histogram :
| C.I. | Frequency |
|---|---|
| 1-6 | 6 |
| 7-12 | 12 |
| 13-18 | 20 |
| 19-24 | 15 |
| 25-30 | 9 |
Statistics
3 Likes
Answer
Adjustment factor
New lower limit = Lower limit - Adjustment factor
New upper limit = Upper limit + Adjustment factor
| C.I. | New C.I. | Frequency |
|---|---|---|
| 1-6 | 0.5-6.5 | 6 |
| 7-12 | 6.5-12.5 | 12 |
| 13-18 | 12.5-18.5 | 20 |
| 19-24 | 18.5-24.5 | 15 |
| 25-30 | 24.5-30.5 | 9 |
Steps :
Take 2 cm along x-axis = 6 units and 1 cm along y-axis = 3 units.
Since, the scale on x-axis starts at 0.5, a break (zig-zag curve) is shown near the origin along x-axis to indicate that the graph is drawn to scale beginning at 0.5 and not at origin itself.
Construct rectangles corresponding to the given data.
In highest rectangle, draw two st. lines AC and BD from corners of the rectangles on either side of the highest rectangle to the opposite corners of the highest rectangle. Let P be the point of intersection of AC and BD.
Through P, draw a vertical line to meet the x-axis at M. The abscissa of the point M represents 16.
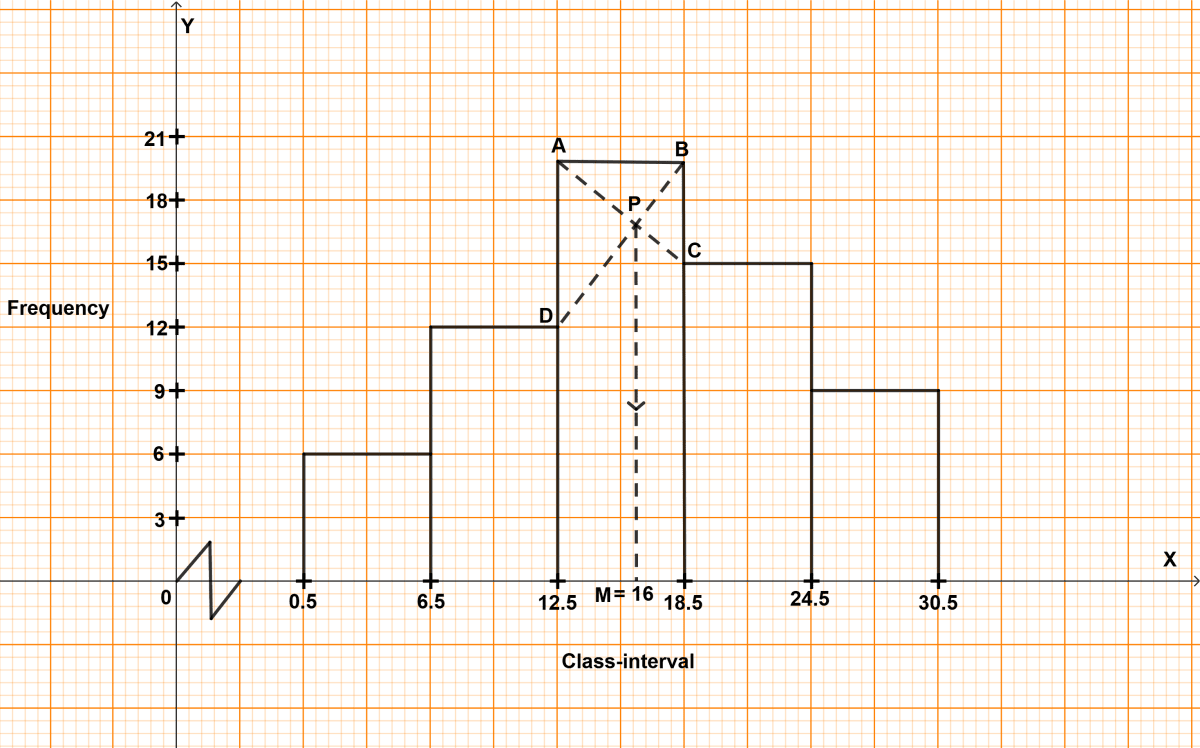
Hence, mode = 16.
Answered By
1 Like
Related Questions
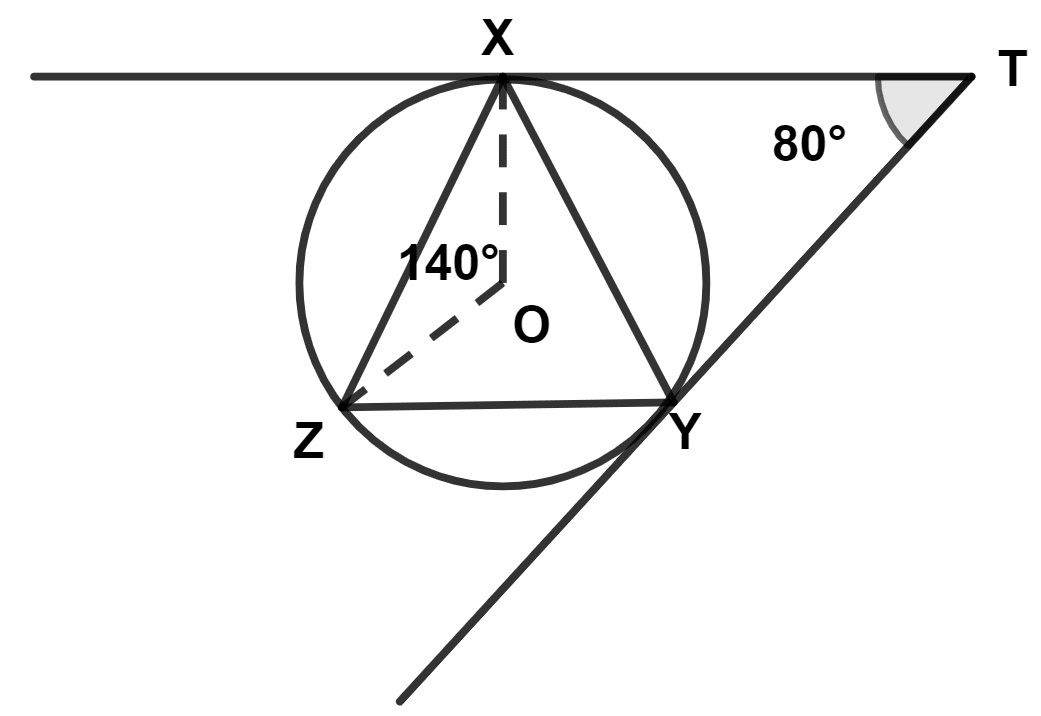
O is the center of the circumcircle of △ XYZ. Tangents at points X and Y meet each other at point T. If ∠XOZ = 140° and angle XTY = 80°, find angle ZXY.
The third term of a G.P. be one-fourth of fifth term and their sum is . If each term of this G.P. is positive, find its 10th term.
A solid is in the form of right circular cylinder with a hemisphere at one end and a cone at the other end. The radius of the common base is 2.8 cm and heights of cylinder and conical portions are 14 cm and 7 cm respectively. Find :
(i) the total surface area of the solid
(ii) the volume of the solid
Take π = and find your answers correct to two decimal places.
In rhombus ABCD, A(7, 3) and C(0, -4) are two opposite vertices. Find :
(i) mid-point of diagonal AC
(ii) mid-point of diagonal BD
(iii) slope of diagonal AC
(iv) the equation of diagonal BD.